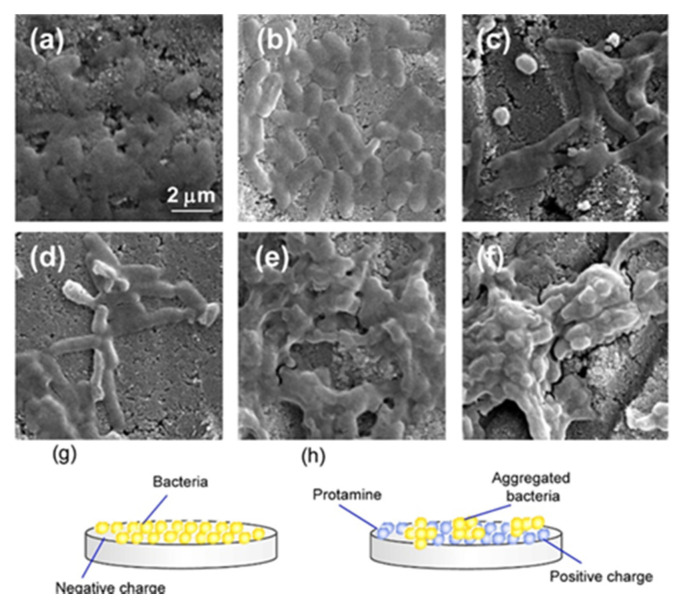
Figure 4.
SEM images of E. coli cells on the surface of protamine/HAp discs. E. coli cells cultured on various concentrations of protamine/HAp discs: (a) 0 (HAp), (b) 125, (c) 250, (d) 500, (e) 1000, and (f) 2000 μg∙mL−1 for 24 h were observed by SEM. Bar indicates 2 μm. Schematic diagram of the adhesion of bacteria to HAp (g) or protamine/HAp disc (h).

