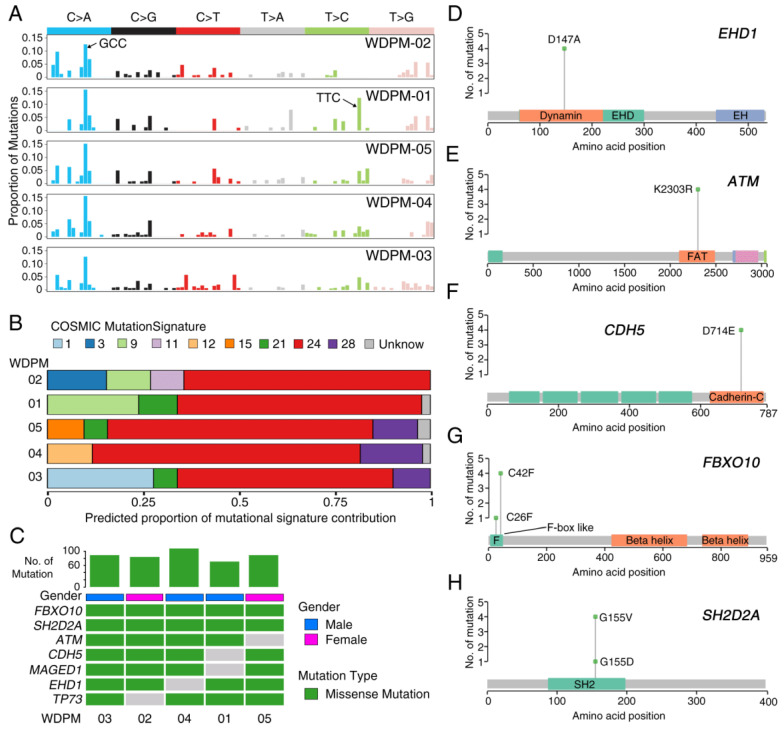
Figure 2.
Landscape of mutations in WDPM. (A) Mutational signature present in WDPM. (B) Proportional contribution of different COSMIC mutational signature per sample. (C) Mutation status in WDPM. Top seven most recurrent mutations are represented in the figure. The bar plot on the top panel represents the total number of mutations detected in the respective WDPM. (D–H) Plots showing mutation distribution and the protein domains for the corresponding mutated protein.

