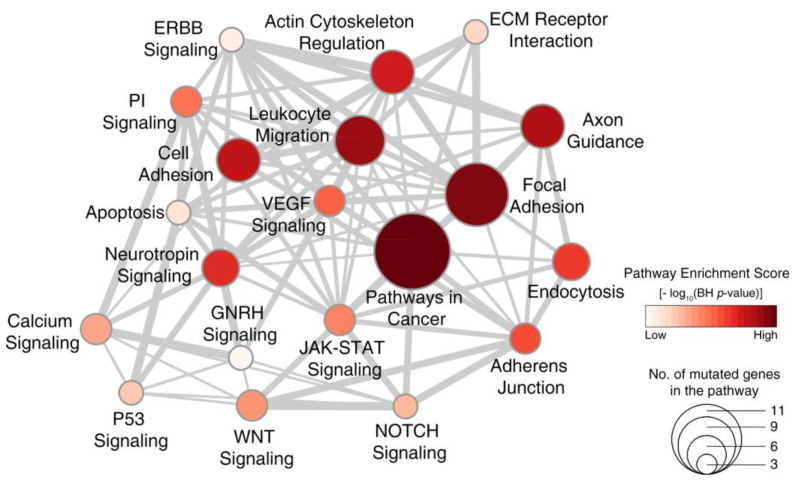
Figure 3.
Signaling pathways dysregulated in WDPM. We performed pathway enrichment analysis using genes mutated in WDPM cases against the signaling pathways in the KEGG pathway database. The figure shows the top 20 pathways enriched with mutated genes in WDPM. Each circle represents a pathway, its size indicates the number of mutated genes targeting the pathway, and its color indicates the pathway enrichment score. The thickness of edges connecting two circles (pathways) is proportional to the number of mutated genes common between the two pathways. PI signaling: phosphatidylinositol signaling pathway.

