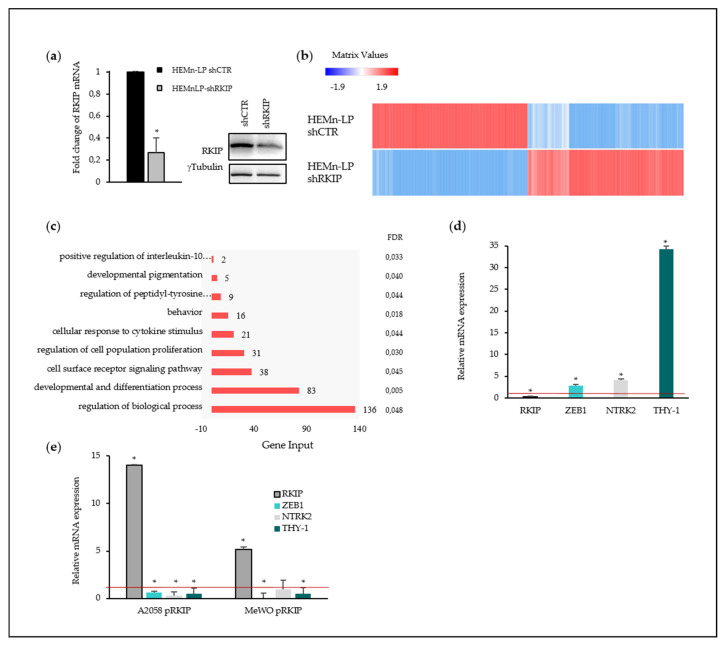
Figure 5.
RNA Sequencing data and analysis. (a) RKIP mRNA and protein levels in RKIP-downregulated HEMn-LP. Normal melanocyte cell line HeMn-LP was transduced with RKIP shRNA Lentiviral Particles or Control shRNA Lentiviral Particles following the manufacturer´s instruction. Two days after infection, the cells were selected with Puromycin to get stable cell lines. The RKIP downregulation were validated by RT-qPCR and Western Blot; (b) Clustergram analysis showing differential expression genes data set comparing controls versus RKIP knockdown HEMn-LP cells; (c) Every row of the figure represents one enriched process after RKIP downregulation with an FDR cutoff of 0.05; (d) Relative expression of three selected genes for RNASeq results validation in shRKIP HEMn-LP; (e) Relative expression of three selected genes for RNASeq results validation in metastatic melanoma cells after RKIP upregulation. (d,e) ACTB was used as a housekeeping gene for relative quantification. The average of three independent assays have been shown. The red line highlights the control normalized expression level. * p-value < 0.05.

