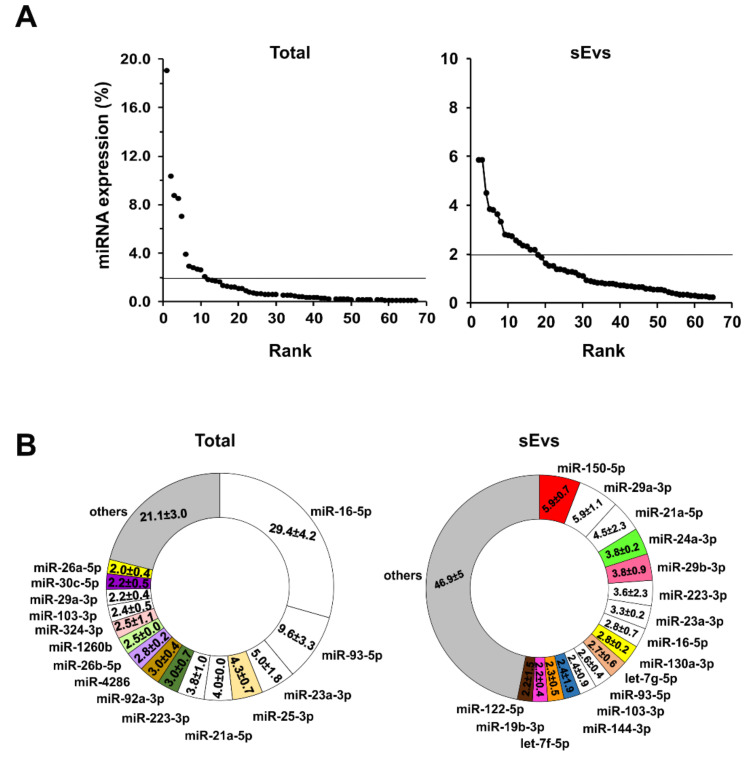
Figure 6.
Conserved miRNA abundance analysis in the mouse plasma. (A) Rank abundance curve of the conserved miRNAs both expressed in the mouse total plasma (left panel) and enriched in the sEVs (right panel). The threshold was set at 2% of the miRNA expression (horizontal line). (B) The most abundant conserved miRNAs are shown in the ring graph in both total plasma (left panel) and sEV (right panel) compartments. The number reported in each slice of the ring represents the percentage of expression of the indicated miRNA.

