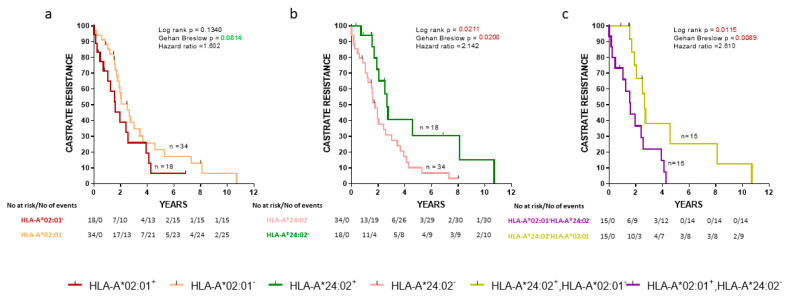
Figure 1.
Kaplan-Meier curves illustrate the time to castration-resistance (CR) progression among groups of de novo metastatic prostate cancer (mPCa) patients. (a) HLA-A*02:01+ vs HLA-A*02:01−; (b) HLA-A*24:02+ vs HLA-A*24:02−; (c) HLA-A*02:01+ HLA-A*24:02− vs HLA-A*24:02+ HLA-A*02:01−. Shown are statistical differences and hazard ratios among the groups.

