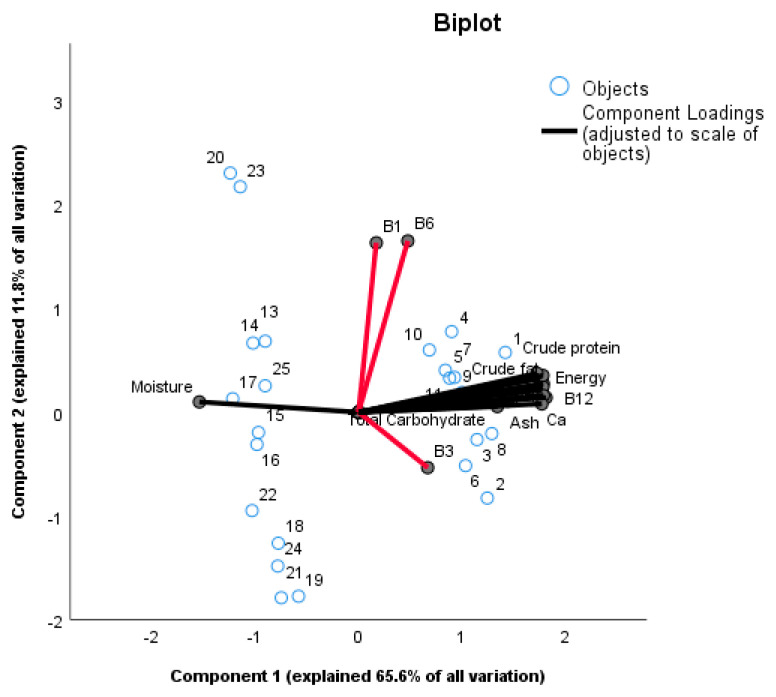
Figure 1.
Principal Components Analysis (PCA) bi-plot with Optimal Scaling of Mabisi (numbers 1 to 12) and Munkoyo (numbers 13 to 25) samples are indicated as blue circles to determine variation in nutritional parameters within and in between sample types. PC1 explained 65.6% of all variation while PC2 explained 11.8% of all variation giving a total of 77.4% variation explained by the two components.

