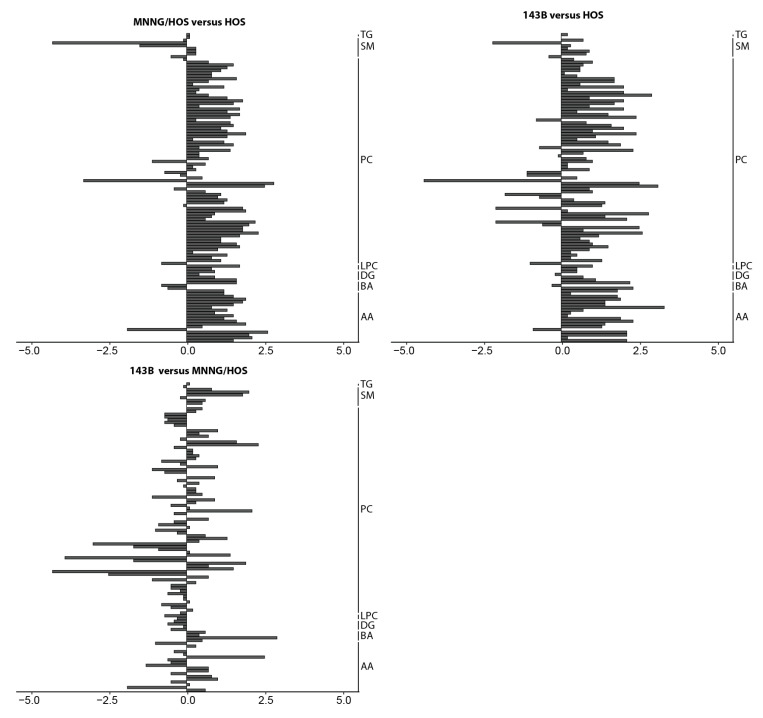
Figure 2.
Enhanced lipid metabolism in malignant and metastatic osteosarcoma (OS) cells. Measured compounds comparing MNNG/HOS to HOS, 143B to HOS and 143B to the MNNG/HOS cells. For each cell type, n = 5 replicates were measured. Data are log2 values from the ratios calculated from the mean of the normalized areas (liquid chromatography measurement) or intensities (flow injection analysis measurement). AA: amino acids. BA: biogenic amines. DG: diglycerides. LPC: lysophosphatidylcholines. PC: phosphatidylcholines. SM: sphingomyelins. TG: triglycerides.

