Figure 1.
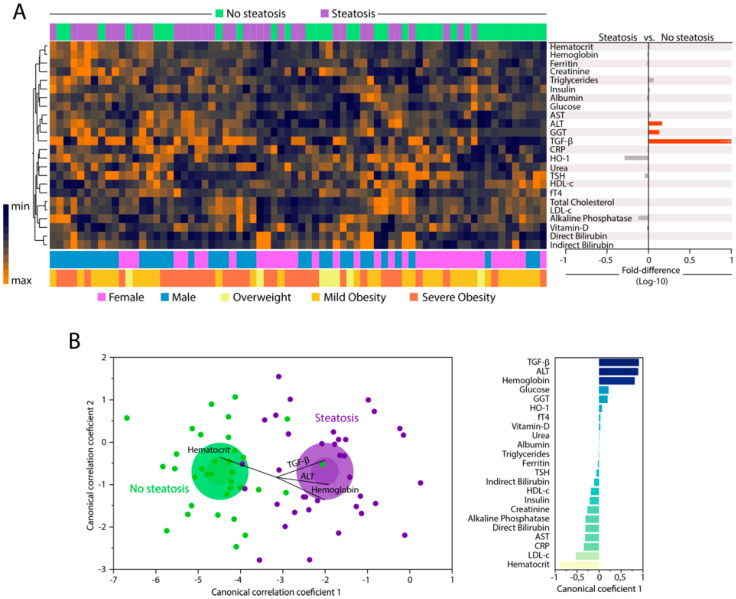
Changes in biochemical proteins of peripheral blood distinguish patients with and without hepatic steatosis. Plasma was assessed in samples from patients without hepatic steatosis (n = 36) and patients with hepatic steatosis (n = 36). Data were Log10 transformed and z-score normalized. (A) Left panel: In hierarchical cluster analysis (Ward’s method with 100X bootstrap) was employed to depict the overall expression of plasma proteins in study population. Right panel: Average fold-difference values in plasma proteins levels for patients with hepatic steatosis and without steatosis group. Differences which reached statistical significance with the Mann-Whitney U test adjusted for multiple comparisons using the Holm-Bonferroni’s method (Adjusted p < 0.05) are represented in colored bars. (B) Left panel: In an exploratory approach, a sparse canonical correlation analysis (sCCA) was employed to test whether experimental groups could be distinguished based on correlation profiles of the combined circulating markers. Vector analysis was used to plot the direction of influence of the most significant parameters in the canonical space. Right panel: Canonical coefficient scores were calculated to identify the biomarkers responsible for the difference between groups in the sCCA model. Abbreviations (alphabetic order): ALT: alanine aminotransferase; AST: aspartate aminotransferase; CRP: C-reactive protein; fT4: free thyroxine; GGT: gamma-glutamyl transferase; HDL-c: high density cholesterol; HO-1: heme oxygenase-1; TGF-β: transforming growth factor β; TSH: thyroid-stimulating hormone.

