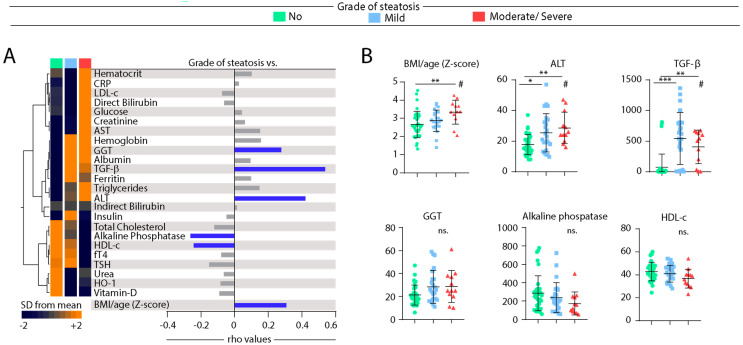
Figure 3.
Spearman correlation of biochemical parameters in blood of patients according grade of hepatic steatosis. (A) Left panel: Data on each parameter was Log10 transformed. Mean values for each indicated clinical group were z-score normalized and a Hierarchical cluster analysis was performed to illustrate the overall biochemical profiles according the grade of diseases. Right panel: Correlation between grade of hepatic steatosis and biochemical parameters. Spearman correlation analysis was used, and rho values are shown. Blue lines represent correlations with statistical relevance. (B) Scatterplots of concentrations of indicated parameter which values presented statistically significant differences between the study groups using the Kruskal-Wallis test with Dunn’s multiple comparisons ad hoc test (* p < 0.05, ** p < 0.01, *** p < 0.001, ns: nonsignificant) # represent statistical significance (p < 0.05) of non-parametric linear trend ad hoc test. Bars represent median values whereas whiskers represent the interquartile ranges. Abbreviations (alphabetic order): ALT: alanine aminotransferase; AST: aspartate aminotransferase; BMI: body mass index; CRP: C-reactive protein; fT4: free thyroxine; GGT: gamma-glutamyl transferase; HDL-c: high density cholesterol; HO-1: heme oxygenase-1; TGF-β: transforming growth factor β; TSH: thyroid-stimulating hormone.

