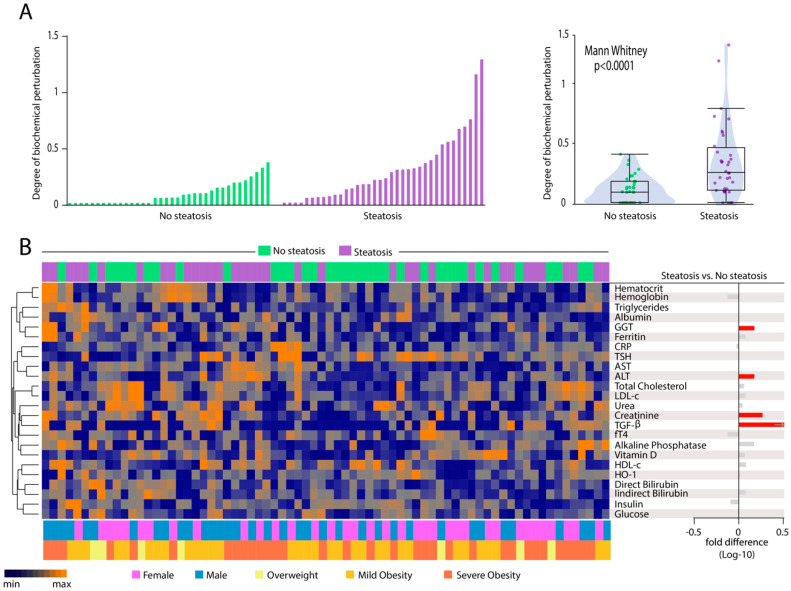
Figure 4.
Hepatic steatosis is associated with increases in degree of biochemical perturbation. (A) Left panel: Histograms show the single sample degree of biochemical perturbation (DBP) score values relative to each study group as indicated. Right panel: Box plots represent the distribution of the DBP between study groups. Values were compared between patients with and without steatosis using Mann Whitney U test. (B) Left panel: A hierarchical cluster analysis (Ward’s method) was employed to show the molecular degree of perturbation of each biochemical marker. Right panel: Average fold-difference values in DBP for patients with hepatic steatosis and without steatosis group. Abbreviations (alphabetic order): ALT: alanine aminotransferase; AST: aspartate aminotransferase; CRP: C-reactive protein; fT4: free thyroxine; GGT: gamma-glutamyl transferase; HDL-c: high density cholesterol; HO-1: heme oxygenase-1; TGF-β: transforming growth factor β; TSH: thyroid-stimulating hormone.

