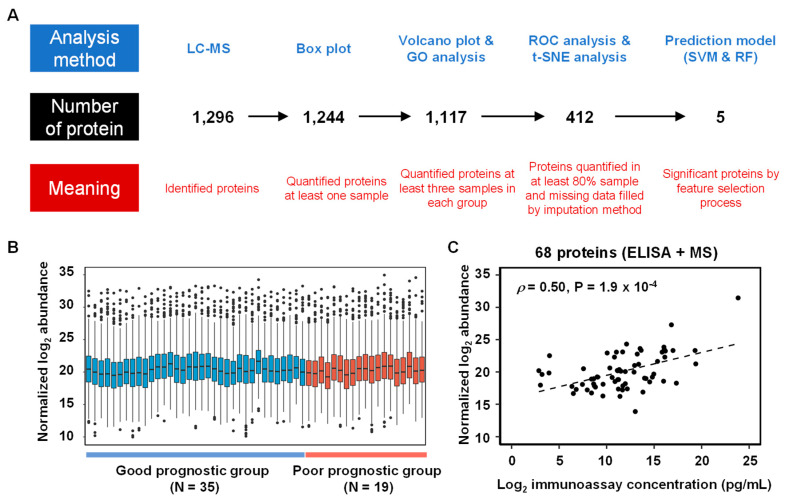
Figure 1.
(A) Analysis workflow of urinary proteins in the 54 diabetic kidney disease (DKD) patients. The analysis method is written in the upper part, the number of proteins in the middle, and the meaning of the protein in the bottom part. (B) Boxplots of normalized urinary protein abundances in the 54 samples (35 patients in good-prognostic group and 19 patients in poor-prognostic group) measured by LC-MS analysis. (C) Scatter plot of 68 urine proteins between normalized log2 abundance and log2 immunoassays concentration (Pearson correlation coefficient (ρ): 0.5 and p-value: 1.9 × 10⁻⁴).

