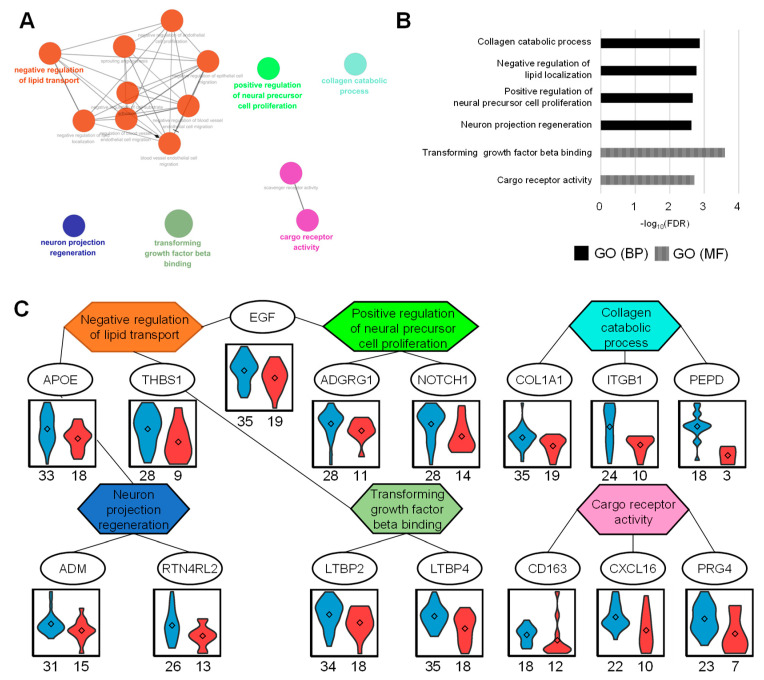
Figure 3.
Up-regulated proteome in good prognosis group (GPG) and gene ontology (GO) analysis. (A) Functional GO network displaying grouping of GO terms enriched in GPG up-regulated proteins. (B) Enriched GO terms in biological process and molecular function. (C) The network between GO terms and corresponding proteins represents the relationship between GO terms via the proteins. The abundances of each protein represent the violin plots in two groups. The numbers listed below represent the measured numbers for each group.

