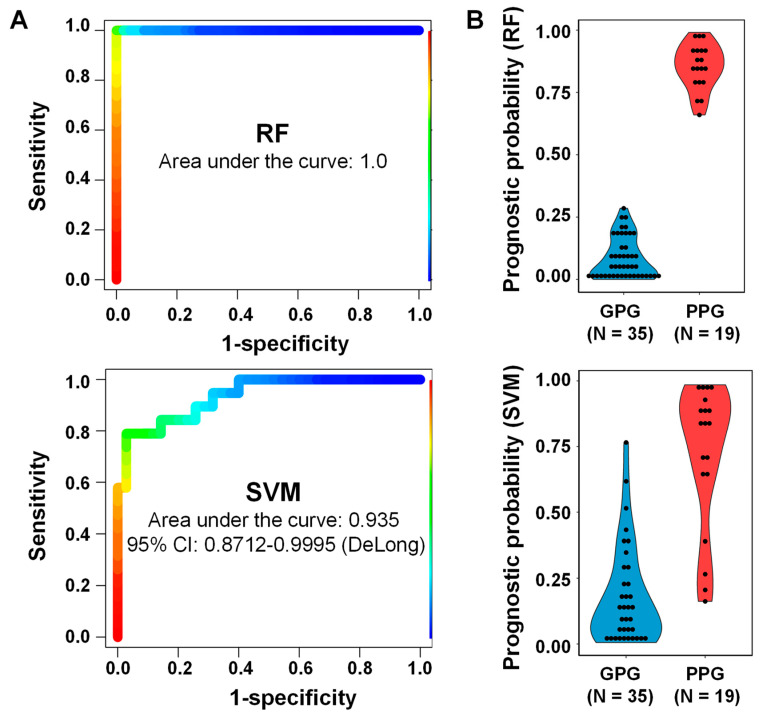
Figure 6.
ROC curves of RF and SVM classifiers for five selected proteins (ACP2, CTSA, GM2A, MUC1 and SPARCL1). Performance of the two classifiers in the set of 54 samples, 35 from patients with good prognosis and 19 from patients with poor prognosis. (A) Areas under the curve (AUC) for the RF (1.0) and SVM (0.935) classifiers. (B) Clinical indices (0–1) of the two classifiers.

