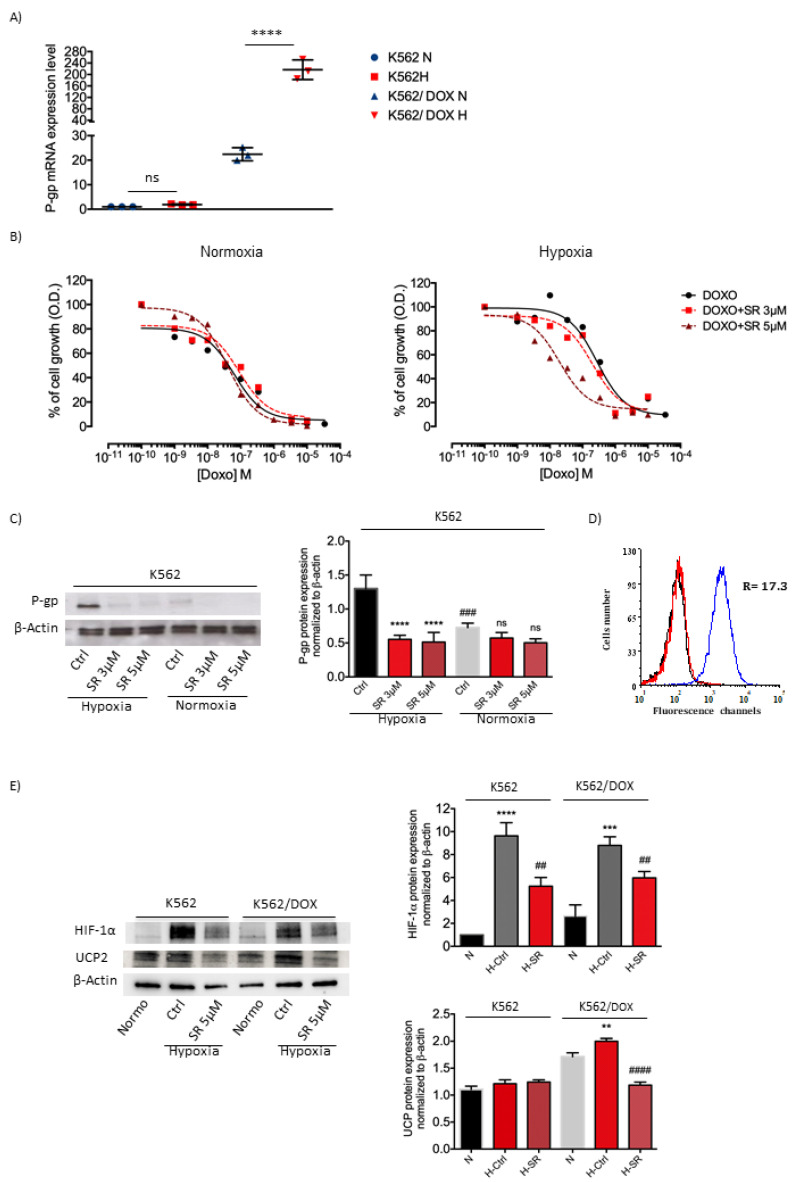
Figure 6.
P-gp, HIF-1α and UCP2 expression, and evaluation of cytotoxicity of SR59230A and SR59230A/doxorubicin combination. (A) Real-time PCR analysis: P-gp mRNA expression assessed in K562 and K562/DOX cell lines under hypoxia (1% O2) and normoxia (21% O2); significance was calculated by one-way ANOVA analysis followed by Bonferroni’s post-hoc test. Results are reported as mean ± SD of three independent experiments. n=3 per group. (B) Cytotoxicity curves of doxorubicin in normoxia and hypoxia in the absence and in the presence of two concentrations of SR59230A (3 µM and 5 µM) in K562 cell line. Results are reported as mean of three independent experiments. (C) Western blot analysis showing P-gp expression in K562 cells treated with SR59230A at 3 µM and 5 µM under hypoxia and normoxia. Significance was calculated by one-way ANOVA analysis followed by Bonferroni’s post-hoc test. Results are reported as mean ± SD of three independent experiments. n = 3 per group. (D) Fluorescence curves obtained with a FACScanto flow cytometer. R= ratio between the mean fluorescence intensity of resistant cells and parental cells. K562 cells (red) and K562/DOXO cells (blue), black curve: autofluorescence. (E) Western blot analysis showing HIF-1α and UCP2 expression in K562 and K562/DOXO cells treated with SR59230A at 5 µM under hypoxia and relative control in normoxia. Significance was calculated by one-way ANOVA analysis followed by Bonferroni’s post-hoc test. Results are reported as mean ± SD of three independent experiments. n = 3 per group.

