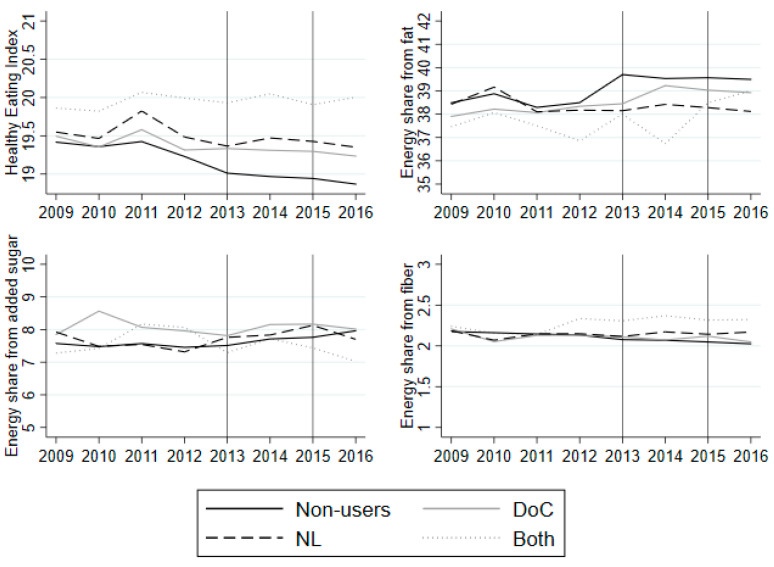
Figure 4.
Average HEI and nutrient shares from 2009 to 2016 for NL switchers (dark grey dashed), DoC switchers (grey solid), Both switchers (light grey dotted), and non-users (black solid). Note: The vertical lines indicate the years in which the questionnaires were sent to the panel. The average is based on households that answered both questions on label use in 2013 and 2015. The averages are based on an unbalanced panel from 2009 to 2016, as not all of the household stay in the panel from 2009 to 2016.

