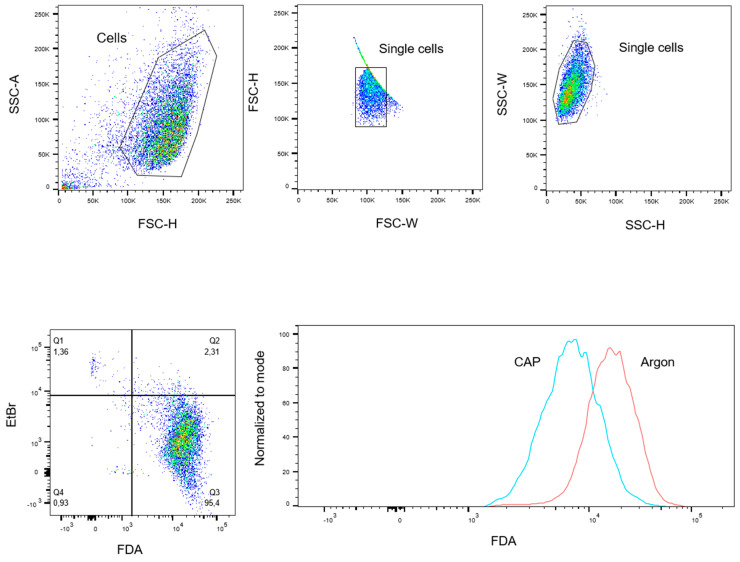
Figure 8.
Gating Strategy. Fluorescein diacetate (FDA) content per cell was analyzed by flow cytometry. Debris and doublets were excluded by forward and side-scatter characteristics. Living cells were defined as ethidium bromide (EtBr)-negative and FDA-positive events. For analysis of data, the mean fluorescence intensity (MFI) of FDA was compared. SSC-A: side-scatter area, SSC-H: side-scatter height, FSC-W: forward-scatter width, FSC-H: forward-scatter height.

