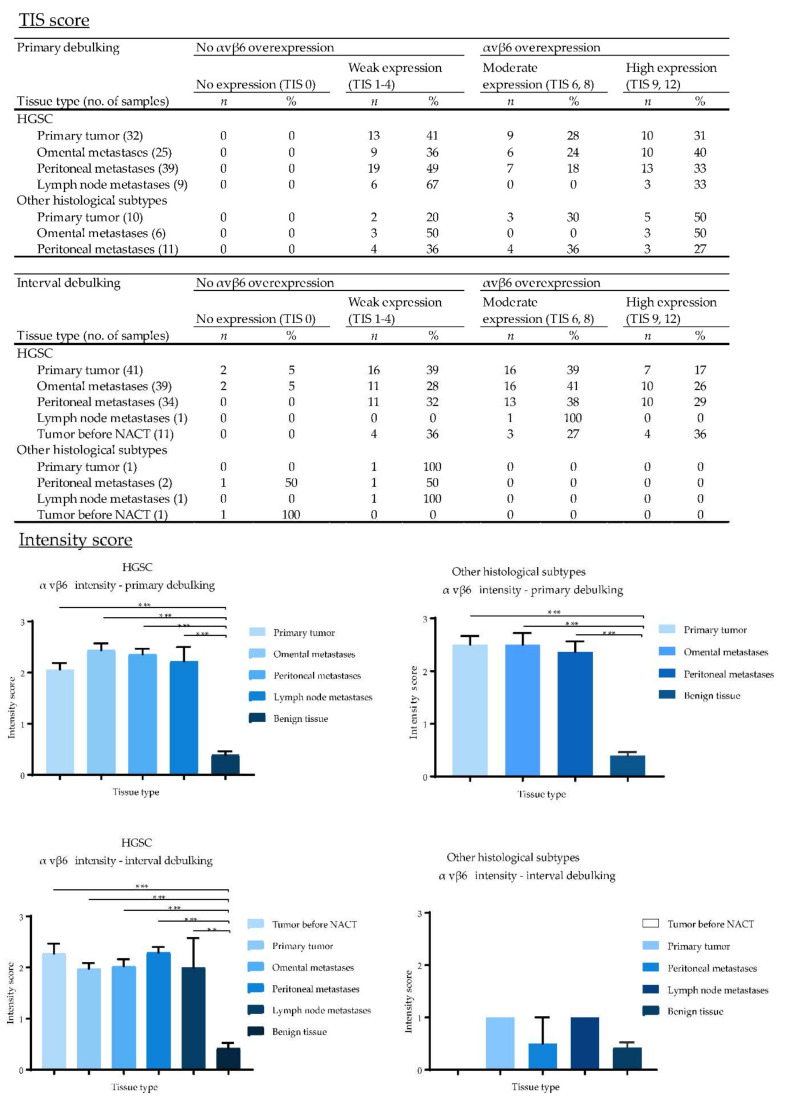
Figure 6.
Total immunostaining scores (TIS) and intensity scores of αvβ6 for all malignant and benign tissue samples divided by the type of debulking procedure and histological subtype. TIS scores were calculated by multiplying the proportion score (PS), representing the percentage of positively stained tumor cells, with the intensity score (IS) to give one of nine possible values; 0, 1, 2, 3, 4, 6, 8, 9 and 12. Figures with no annotated error bars only represent one sample; for these samples the standard error of the mean (SEM) cannot be provided. (*: p < 0.01, ***: p < 0.001).

