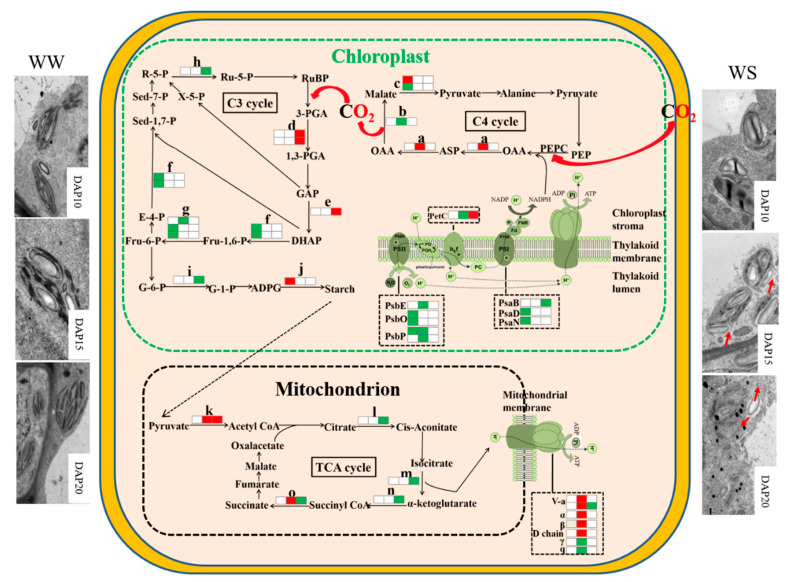
Figure 6.
The pathways of proteomic mechanisms in the pod wall under drought stress. a, Aspartate aminotransferase; b, malate dehydrogenase; c, malic enzyme; d, phosphoglycerate kinase; e, triosephosphate isomerase; f, fructose-1,6-bisphosphate aldolase; g, fructose-1,6-bisphosphatase; h, ribose-5-phosphate isomerase; i, glucose-6-phosphate isomerase; j, starch synthase; k, pyruvate dehydrogenase E1 beta subunit; l, aconitate hydratase; m, isocitrate dehydrogenase (NADP); n, E1 subunit-like 2-oxoglutarate dehydrogenase, o, ATP-citrate lyase/succinyl-CoA ligase. Three squares from left to right represent WS10 vs. WW10, WS15 vs. WW15, and WS20 vs. WW20, respectively. The red squares represent significant upregulation at the 0.05 probability level. The green squares represent significant low-regulation at the 0.05 probability level. The white squares represent no significance. The red arrows show the damaged part of the chloroplast membrane in the pod wall under WS. Define the Dotted black arrow if possible

