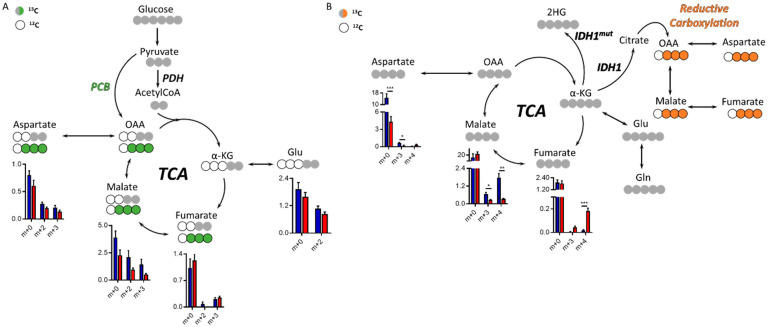
Figure 3.
Tricarboxylic acid (TCA) cycle in the IDH1mut patient-derived indolent and genetically engineered mouse model (GEEM) glioma. (A) Simplified diagram of 13C-tracing experiment utilizing 13C-U-Glucose or (B) 13C-U-Glutamine. Levels of relative intensities for each isotopologue from the TCA cycle metabolite are shown for tumors (red) and contralateral regions (blue). Statistical significance for each isotopologue was assessed by multiple t-tests including Welch’s correction (n = 5–6). *, p < 0.05; **, p < 0.005; ***, p < 0.001. (n = 5–6 animals per cohort and tracer). PCB = pyruvate carboxylase, PDH = pyruvate dehydrogenase, OAA = oxaloacetate, α-KG = α-ketoglutarate.

