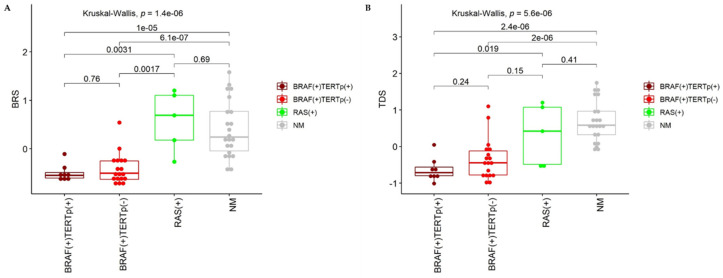
Figure 2.
Analysis of BRS (A) and TDS (B). High BRS depicts RAS-like, whereas low BRS depicts BRAF-like samples. High TDS depicts high expression of thyroid specific genes and high thyroid differentiation. TDS: The Thyroid Differentiation Score, BRS: the BRAF-like RAS-like Score. p-values shown on plots were calculated with Kruskal-Wallis and two-tailed Mann-Whitney tests.

