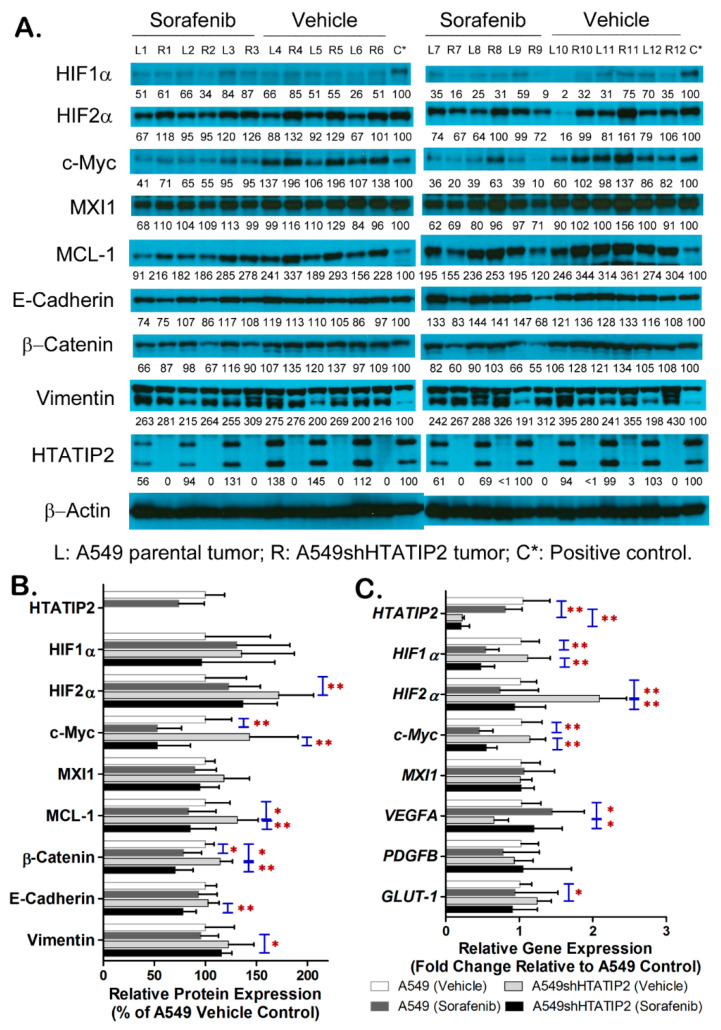
Figure 6.
The aggressive phenotype of A549shHTATIP2 tumors was associated with the upregulated HIF2α expression, enhanced β-catenin/c-Myc/MCL-1 signaling and increased susceptibility of tumor cells to sorafenib-activated EMT process. (A). Western blot images of the expression of HIF1α, HIF2α, selected HIF-regulated proteins and EMT markers in individual tumor samples. The positive control was used to compensate for both systematic and random errors from SDS-PAGE, membrane transfer, immunoblotting and chemiluminescence detection. (B). Quantification of Western blot images using the densitometric analysis. Relative immunoreactive band intensities are expressed as percent change over the average signal value in vehicle control A549 parental tumors with normalization to the β-actin loading control and to the positive control. (C) Fold change of gene expression determined using the quantitative real-time PCR analysis and calculated using the 2-ΔΔCt method. Data represent the GAPDH-normalized target gene expression level relative to that in the vehicle control A549 tumors which is considered 1. Data are presented as mean ± SD. Error bars are SD. * p < 0.05 and ** p < 0.01 compared between A549 parental and A549shHTATIP2 tumors receiving the same treatment or between vehicle and sorafenib treatment in the same type of tumor using the two-sample t-test.

