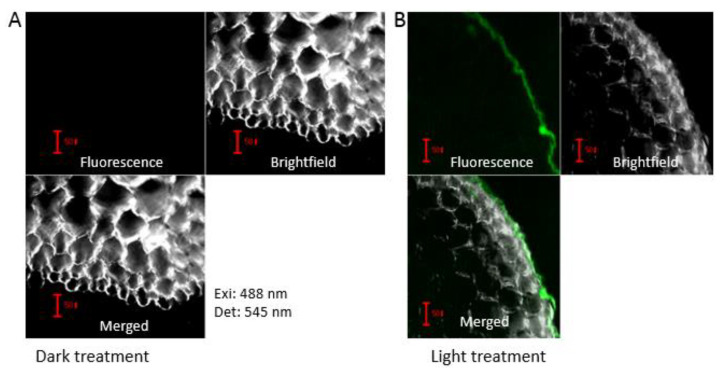
Figure 2.
Anthocyanin distribution in the cross-section of the hypocotyl. Samples were prepared through the hand-sliced method and observed using a confocal microscope. Anthocyanin detection using 488 nm excitation and 545 nm emission. Samples of dark (A) and light (B) treatment viewed with anthocyanin detection field, bright field, and merged images. The scale bars in the figure represent 50 µm. The green color is indicative of anthocyanin presence.

