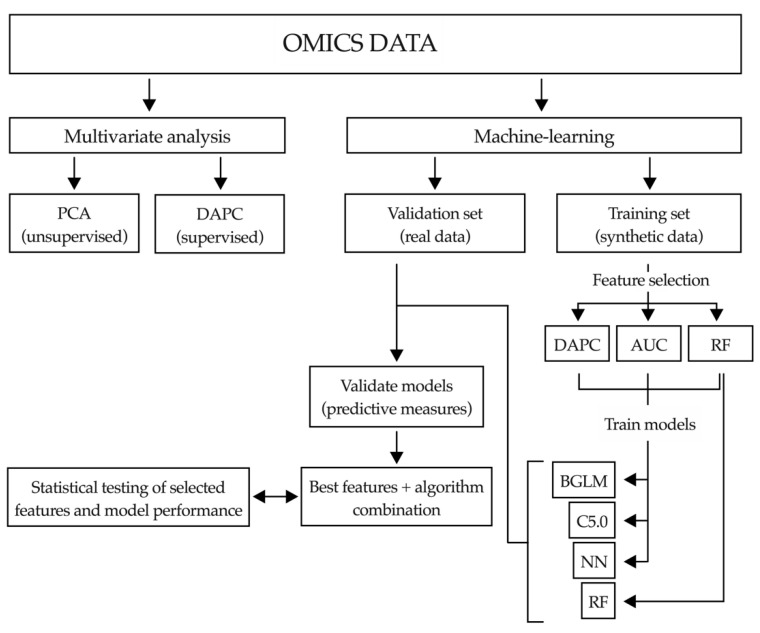
Figure 5.
Flowchart of the data analysis. Overview of the methodology for multivariate analysis and machine-learning approach implemented in this study. PCA: principal component analysis; DAPC: discriminant analysis of principal components; AUC: area under the curve; RF: random forest; BGLM: Bayesian variant of general linear model; NN: neural networks.

