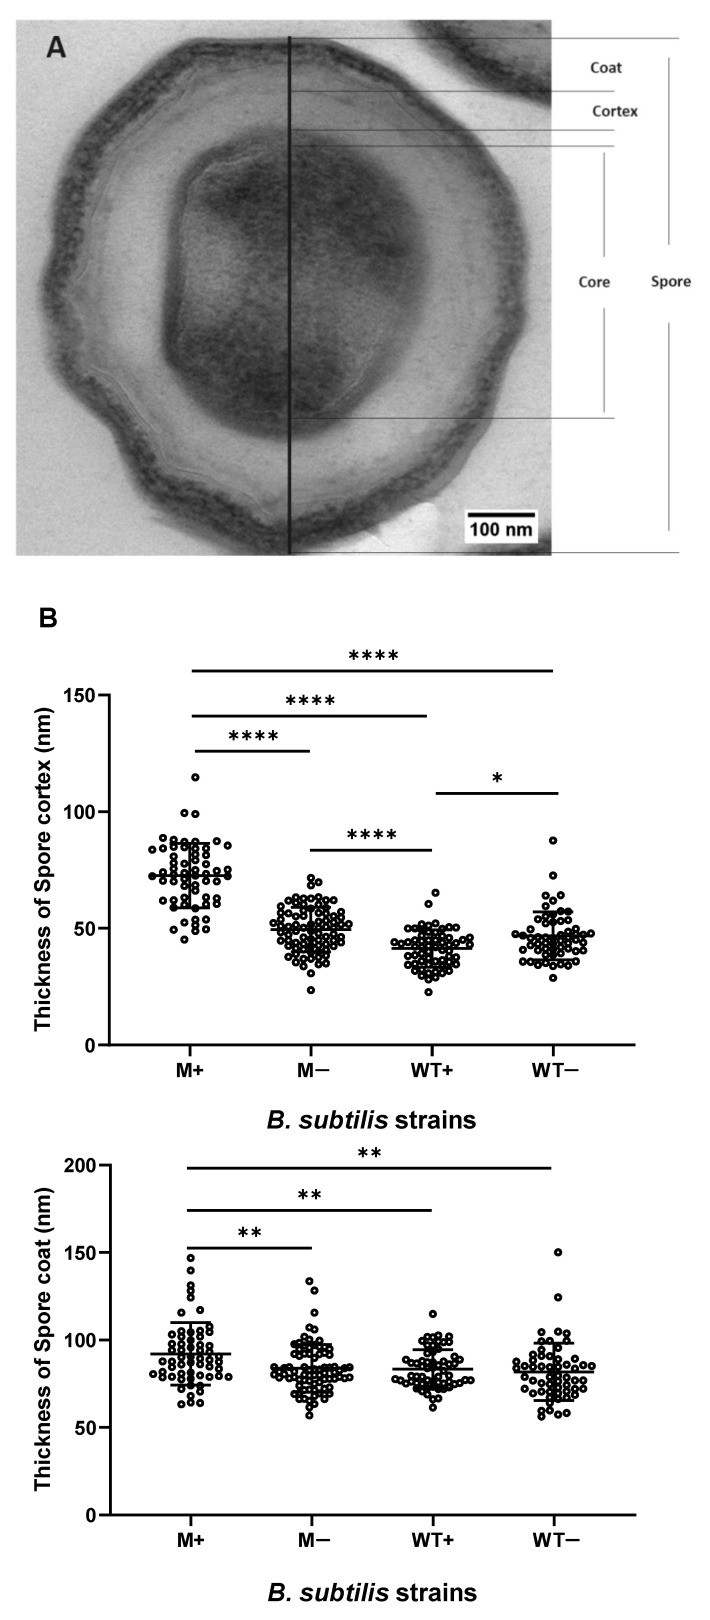
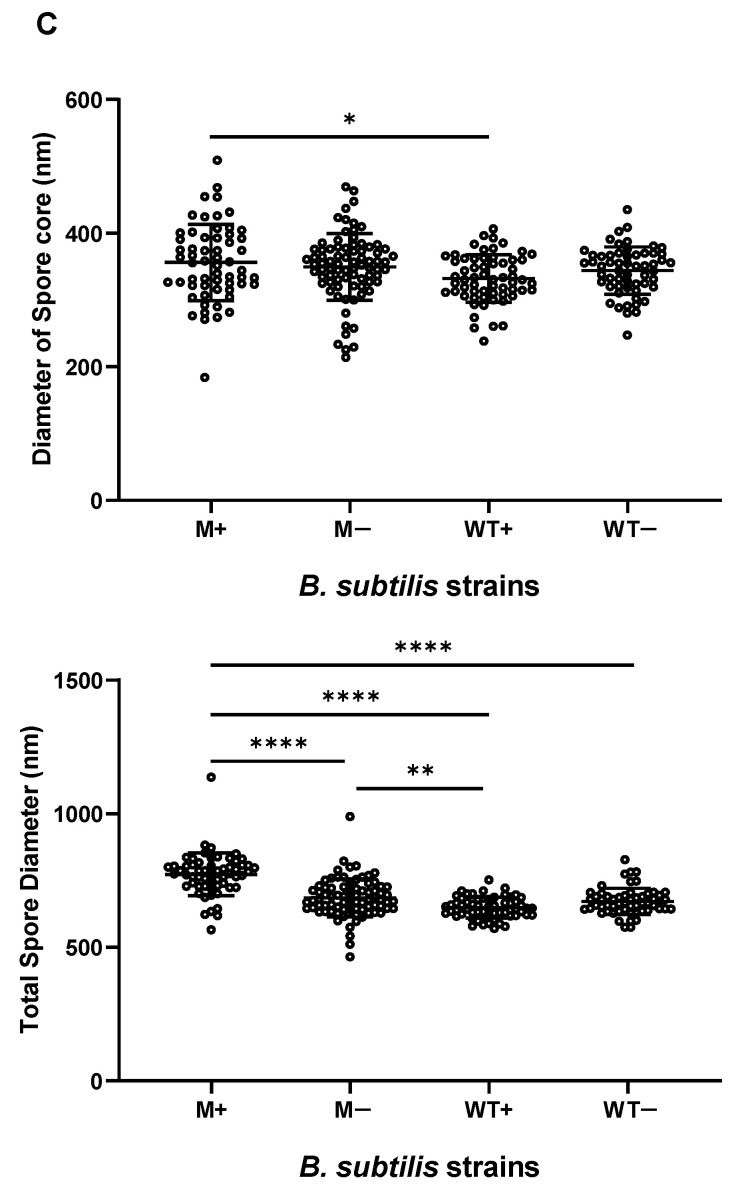
Figure 2.
Effect of kinA-induction on spore structure of B. subtilis wildtype and kinA-inducible mutant strains. Provided are: a representative electron microscopic image of induced mutant spores (A) and the measurements of the thickness of spore coat and cortex layers (B) and the diameters of spores and their cores (C) from Bacillus subtilis wildtype and mutant strain, with and without IPTG. For every sample, over 50 individual spores have been measured (nM+ = 59, nM− = 80, nWT+ =60, nWT− = 57). Statistical significance is determined by a one-way analysis of variance (ANOVA). *, p < 0.05; **, p < 0.01; ****, p < 0.0001. Typical TEM images of different strains are submitted in Supplementary File S2.


