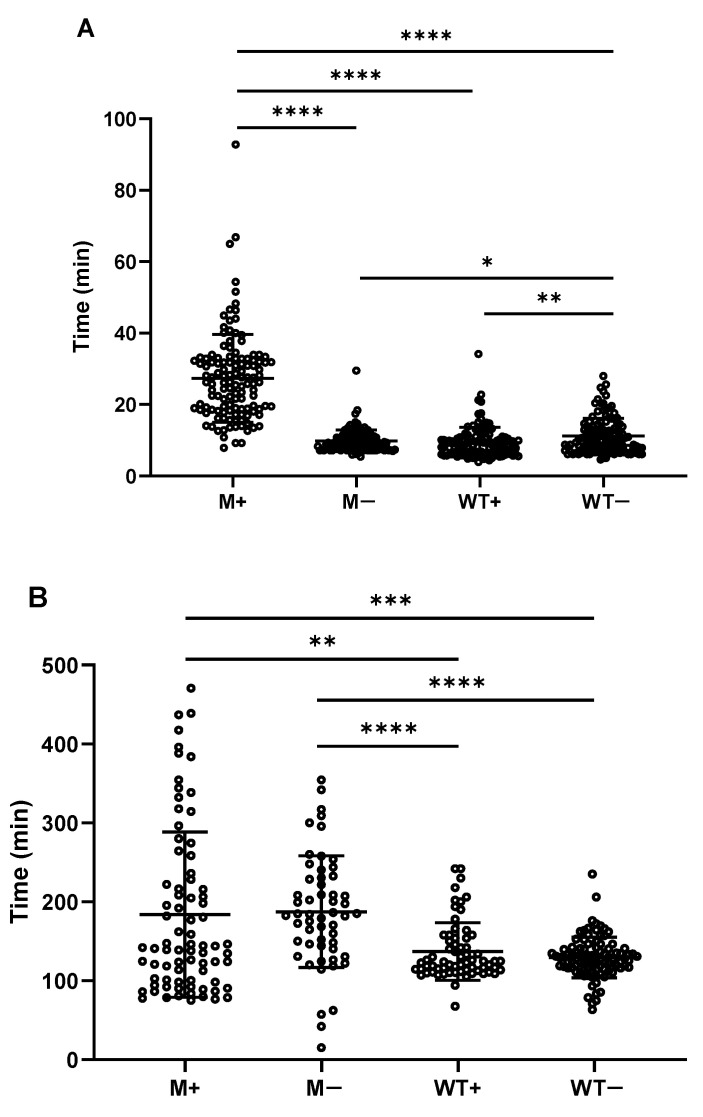
Figure 4.
Distribution of time to start of germination and burst time of spores. Mean and standard deviation were shown in the distribution. (A) time to start of germination of M+ spores (n = 125), M−spores (n = 121), WT+ spores (n = 115) and WT− spores (n = 125), harvested at 24 h after glucose dilution. (B) time from end of germination to start of burst of spores for M+ (n = 78), M− (n = 51), WT+ (n = 66) and WT− (n = 96). Statistical significance is determined by one-way analysis of variance (ANOVA). *, p < 0.05; **, p < 0.01; ***, p < 0.001; ****, p < 0.0001.

