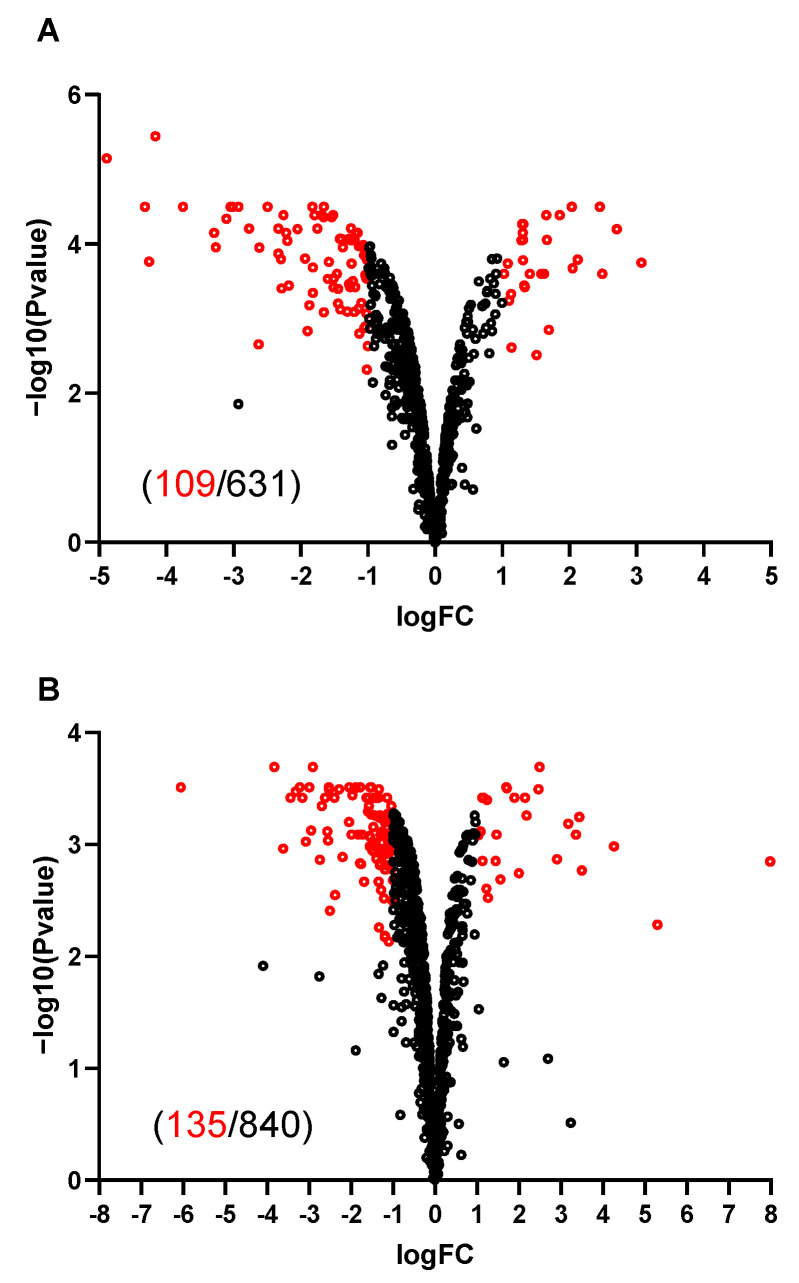
Figure 5.
Volcano plots of proteomic comparison of spores. X-axis indicates the average of log2 isotopic ratios from the replicates. Negative values indicate downregulation and positive values indicate upregulation; Y axis is −log10 p-value. Dots in red indicate differentially expressed proteins. Dots in black indicate proteins that are not significantly changed in protein expression. Numbers in red and black in brackets are the number of differentially expressed proteins and total quantified proteins, respectively. (A) M+ spores are compared to M− sores. (B) M+ spores are compared to WT+ spores.

