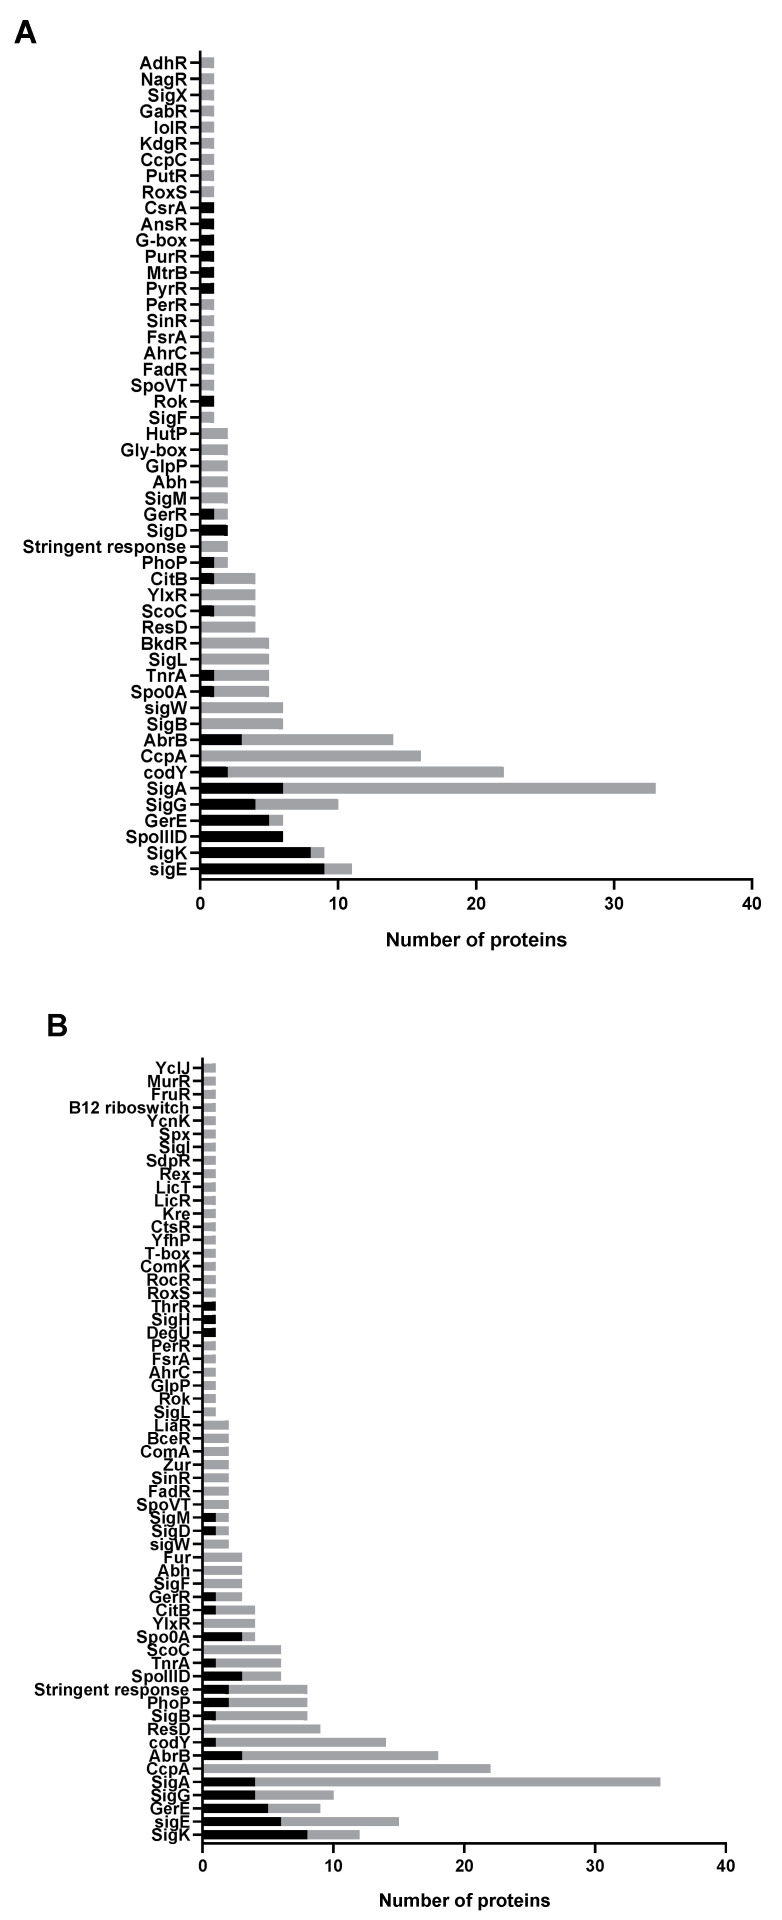
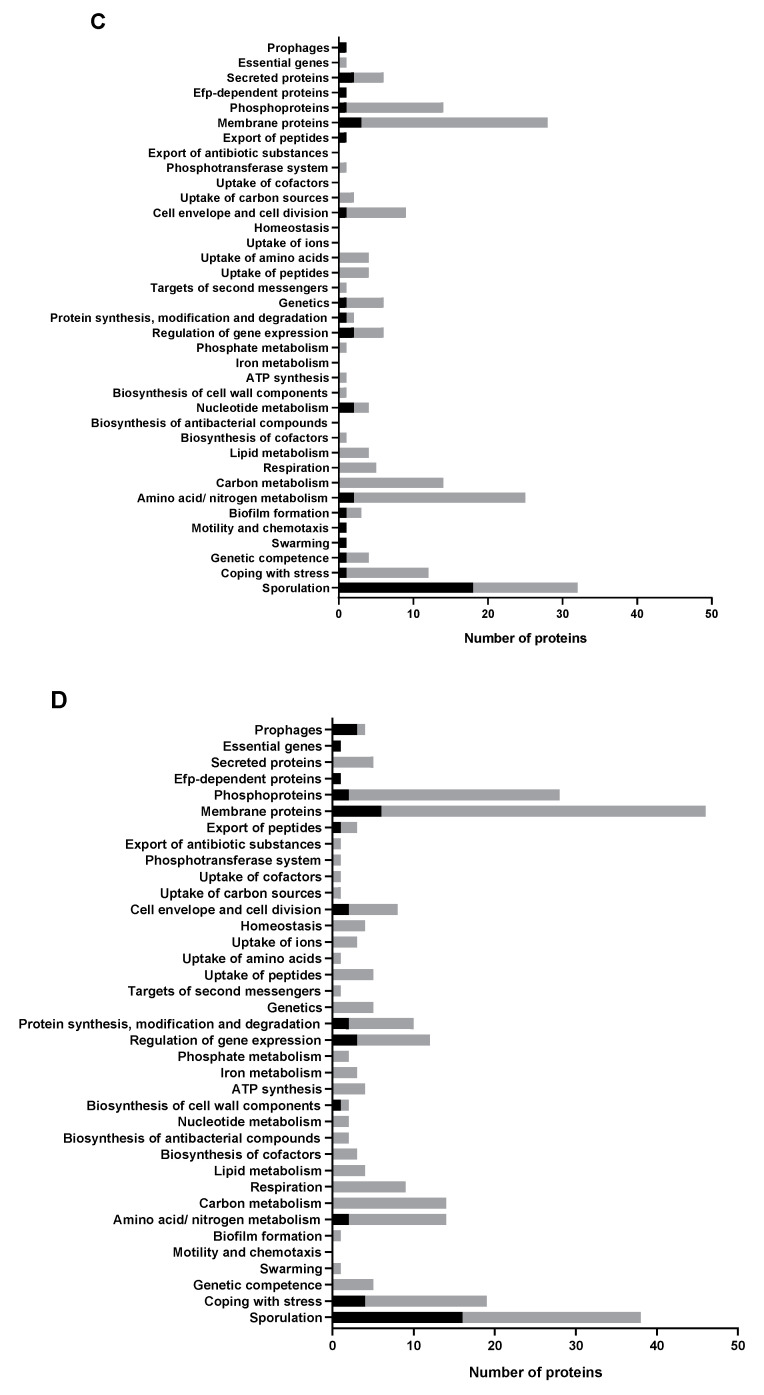
Figure 6.
Regulators and functional classification of differentially expressed proteins. The X-axis indicates the number of proteins classified into regulatory or functional categories, as depicted on the Y-axis. Note that every protein could occupy more than one regulatory or functional category. Bars in black and gray indicate the number of upregulated and downregulated proteins, respectively. (A) Regulators of differentially expressed proteins in M+ spores compared to M− spores. (B) Regulators of differentially expressed proteins in M+ spores compared to WT+ spores. (C,D) are the corresponding functional classification to (A,B) and their respective comparisons.


