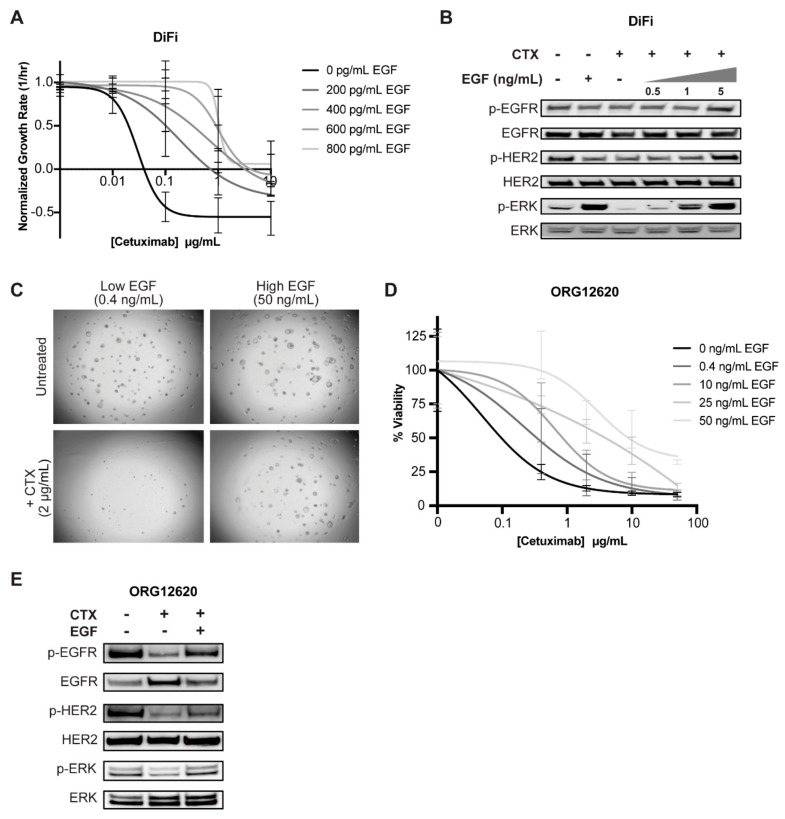
Figure 4.
Exogenous EGF confers cetuximab resistance in cancer cell lines and organoids. (A) DiFi cells were treated with cetuximab in media containing various spike-in levels of EGF. Images were acquired on days 0, 3, and 5. Live and dead cell counts were obtained and fitted to an exponential growth model to calculate the growth rate. (B) After being serum-starved overnight, DiFi cells were treated with 10 µg/mL cetuximab and/or increasing concentrations of EGF for 2 h. Protein expression was evaluated by western blot. (C,D) Patient-derived colon tumor organoid line ORG12620 was treated with increasing concentrations of cetuximab in low EGF (0.4 ng/mL) patient-derived organoid (PDO) defined media for five days. (C) Images were acquired and (D) CellTiter-Glo was performed on organoids to determine percent viability. (E) ORG12620 were serum-starved overnight and treated with cetuximab (10 µg/mL) and/or EGF (100 ng/mL) for 2 h. Protein expression was evaluated via western blot.

