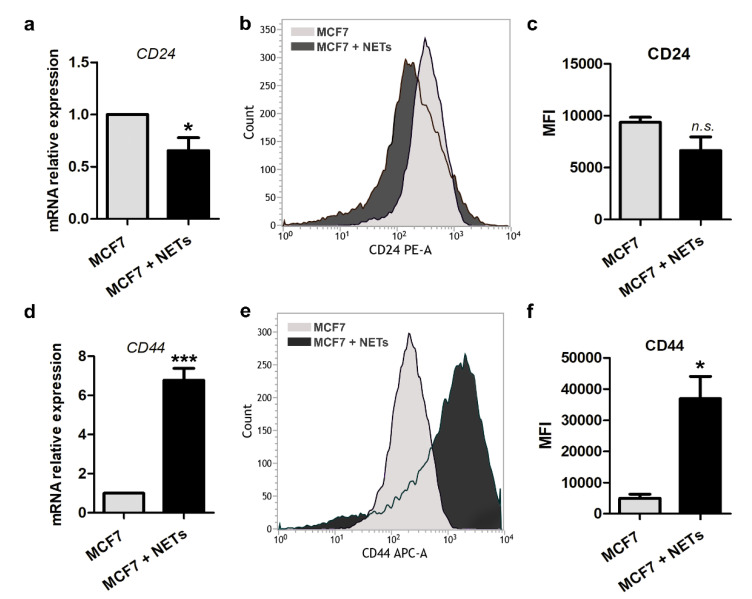
Figure 3.
Cancer stem cell markers are regulated by NETs. Gene expression of CD24 (a) and CD44 (d) was analyzed by quantitative RT-PCR in MCF7 cells that were cultured for 16 h in the absence (gray bar) or the presence (black bar) of NETs (500 ng/mL). GAPDH was used as the reference gene. The relative expression level of the mRNA was calculated using the ΔΔCT method. Values represent means ± SD of three independent experiments. Representative histograms of flow cytometry analysis of CD24 (b) and CD44 (e). Graphic representation of relative mean of fluorescence intensities (MFI) of phycoerythrin (PE)-labeled CD24 antibody (c) and allophycocyanin (APC)-labeled CD44 antibody (f). Data shown are from two independent experiments. Unpaired t-test was applied for statistical analysis. Significance was assumed for * p < 0.05, *** p < 0.001; n.s., no significance.

