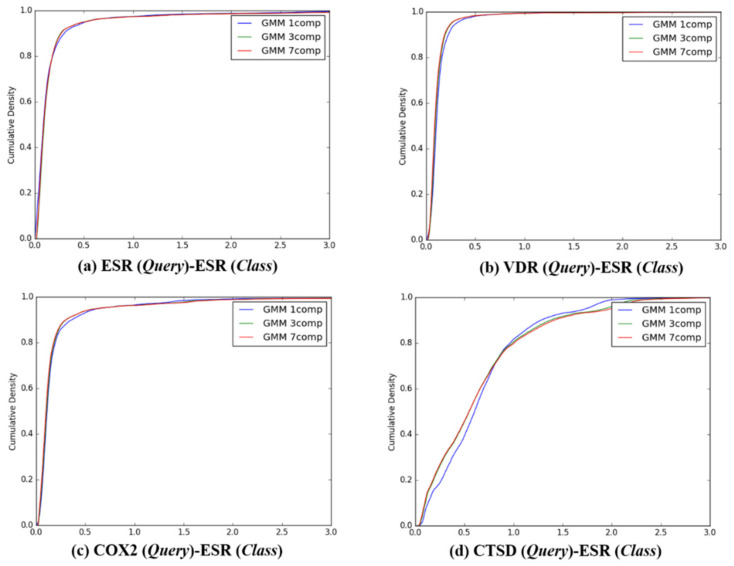
Figure 4.
The cumulative densities of K–L distance between Q-distribution (Target class: ESR) and queries. X-axis: K–L divergence, Y-axis: cumulative density; Q-distribution of ESR through GMM and the distribution of queries were calculated. (a) ESR(Query)-ESR(Class), (b) VDR(Query)-ESR(Class), (c) COX2(Query)-ESR(Class), and (d) ESR(Query)-ESR(Class).

