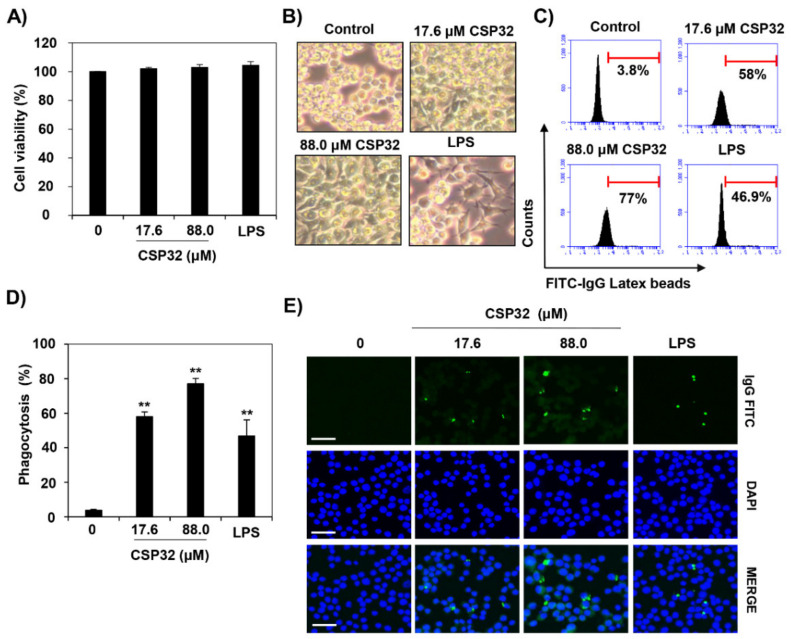
Figure 1.
CSP32 induced morphological changes and phagocytosis of macrophages. Cells were treated with the indicated concentrations of CSP32 and LPS for 24 h. (A) Cell viability was assessed by MTT assay. (B) Representative microscopy images of morphological changes. (C,D) Representative flow cytometric histogram and quantitative analysis of the phagocytosis capacity using fluorescent FITC-IgG latex beads. Data are expressed as the mean ± SD (n = 4). ** p < 0.01 compared with the control. (E) The phagocytic cells were visualized by fluorescence microscopy. The nuclei were stained with DAPI. Scale bar; 200 μm.

