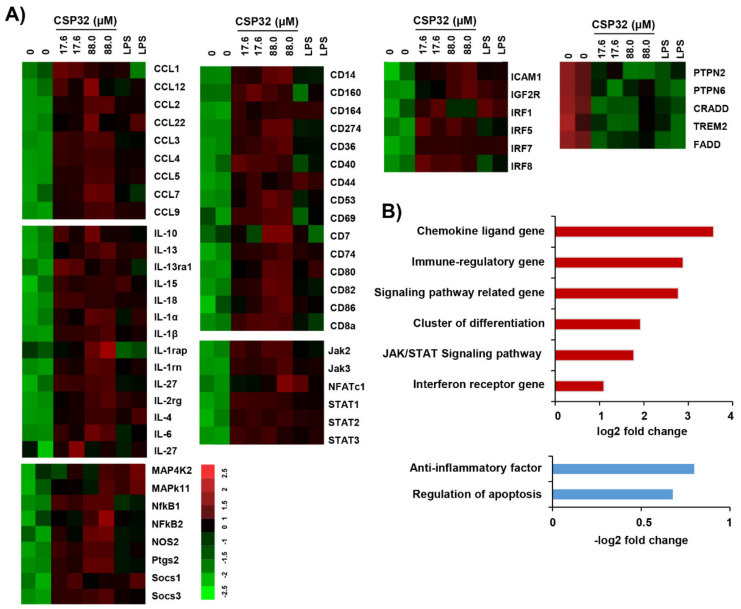
Figure 2.
Microarray gene expression analysis of CSP32 in macrophages. Total RNA was collected by harvesting the CSP32- and LPS-treated cells after 24 h (n = 2). (A) Microarray heatmap representing the log2 fold-change of macrophage polarization-regulated gene expression. Data are expressed as a cut-off of −2.5 to 2.5 (red to green, respectively). (B) Histogram shows the upregulated genes (upper panel) and downregulated genes (bottom panel) ranked by log2 fold-change in expression between untreated cells and 88.0 μM CSP32-treated cells.

