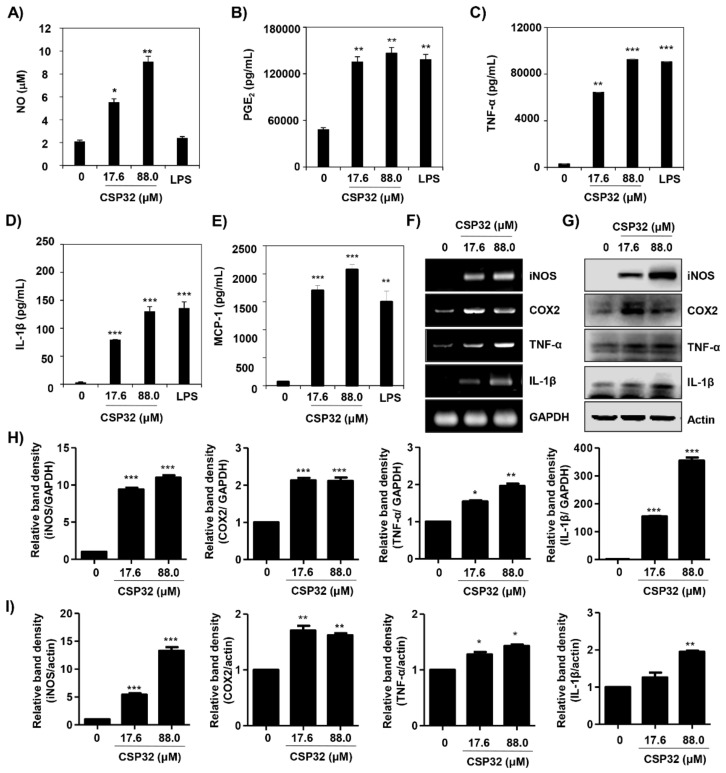
Figure 3.
CSP32 increased the levels of markers for M1 macrophages. Cells were treated with the indicated concentrations of CSP32 and LPS for 24 h. (A) The amount of NO in the cell supernatant was measured using Griess reagents. The levels of PGE2 (B), TNF-α (C), IL-1β (D), and MCP-1 (E) in the culture supernatants were measured by ELISA kits. Data are expressed as the mean ± SD (n = 4). * p < 0.05, ** p < 0.01, and *** p < 0.001 compared with the control. mRNA (F) and protein (G) expression of markers of M1 macrophages, including iNOS, COX-2, TNF-α, and IL-1β. GAPDH and β-actin were used as internal controls for RT-PCR and western blotting. Quantitative analysis of mRNA (H) and protein (I) expression. The expression of each protein was indicated as a fold change relative to the control. Data are expressed as the mean ± SD (n = 3). * p < 0.05, ** p < 0.01 and *** p < 0.001 compared with the control.

