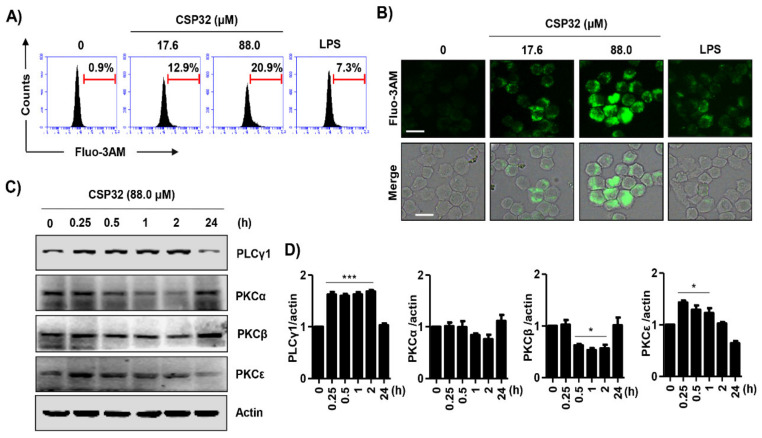
Figure 5.
CSP32 upregulated cytosolic Ca2+ concentrations during M1 polarization. Cells were treated with the indicated concentrations of CSP32 and LPS for 24 h. Then, cells were stained with 2 μM fluo-3-AM for 30 min. (A) Representative histogram from the flow cytometric analysis of fluo-3A-M-positive macrophages following CSP32 and LPS treatment. (B) Representative fluorescence images. Scale bar; 20 μm. (C) At 0, 15 min, 30 min, 1 h, 2 h and 24 h after CSP32 treatment, cells were harvested and lysed. Total cell lysates were examined by western blotting for PLCγ1, PKCα, PKCβ, and PKCε. β-actin was used as an internal control. (D) Quantitative analysis of protein expression. The expression of each protein was indicated as a fold change relative to the control. Data are expressed as the mean ± SD (n = 3). * p < 0.05 and *** p < 0.001 compared with the control.

