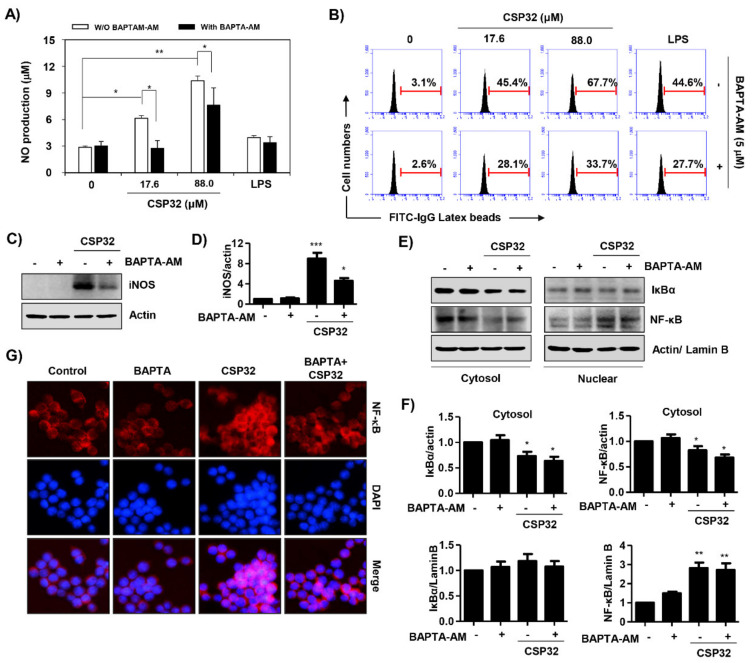
Figure 6.
Ca2+ regulated CSP32-mediated M1 polarization. (A–C) Cells were pretreated with or without 5 μM BAPTA-AM for 30 min and then incubated with the indicated concentrations of CSP32 and LPS for 24 h. (A) The amount of NO in the cell supernatants was measured using Griess reagents. Data are expressed as the mean ± SD (n = 4). * p < 0.05 and ** p < 0.01 compared between the groups. (B) Representative flow cytometric histogram of the phagocytosis capacity using fluorescent FITC-IgG latex beads. (C) Protein expression of iNOS. β-actin was used as an internal control for total cell lysates. (D) Quantitative analysis of iNOS expression that was indicated as a fold change relative to the control. Data are expressed as the mean ± SD (n = 3). * p < 0.05 and *** p < 0.001 compared with the control. (E,F) Cells were pretreated with or without 5 μM BAPTA-AM for 30 min and then incubated with the indicated concentration of 5 μg/mL CSP32 for 1 h. (E) Cytoplasmic and nuclear lysates were examined by western blotting for IκB-α and NF-κB. Actin and lamin B1 serve as the internal controls for the cytoplasmic and nuclear lysates, respectively. (F) Quantitative analysis of IκBα and NF-κB p65 expression that was indicated as a fold change relative to the control. Data are expressed as the mean ± SD (n = 3). * p < 0.05 and ** p < 0.01 compared with the control. (G) Localization of NF-κB p65 (green) was visualized with fluorescence microscopy. Cells were stained with DAPI for visualization of the nuclei (blue).

