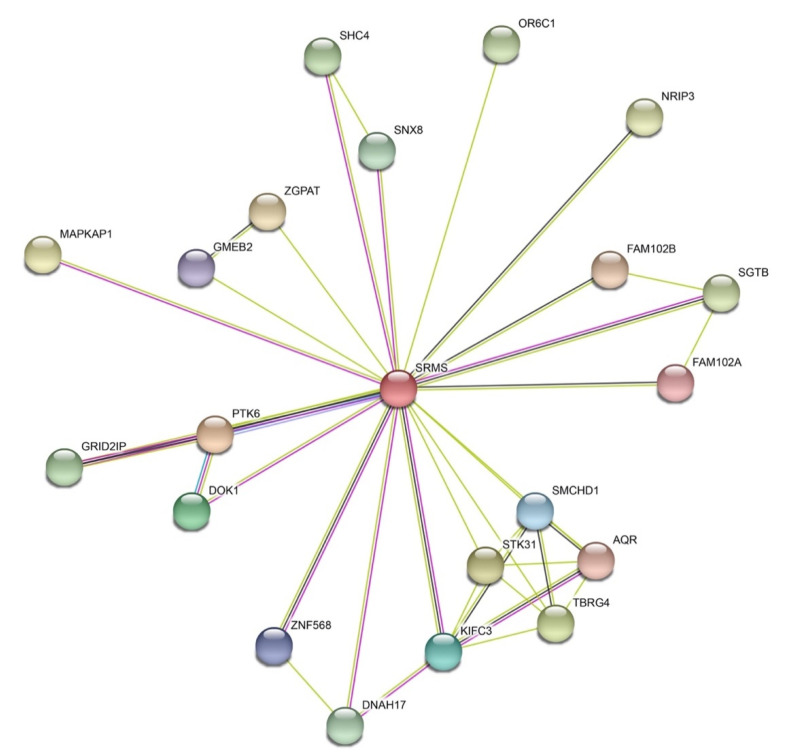
Figure 4.
The SRMS connectome. The human SRMS connectome was analyzed using STRING, version 11 [62]. Data represent 1st shell with a minimum required interaction score of 0.4 and a maximum number of interactors of 20 (https://string-db.org). Blue lines represent known interactions from curated databases, magenta lines represent experimentally determined interactions, light green lines represent predicted interactions from textmining, and black lines represent predicted interactions from co-expression.

