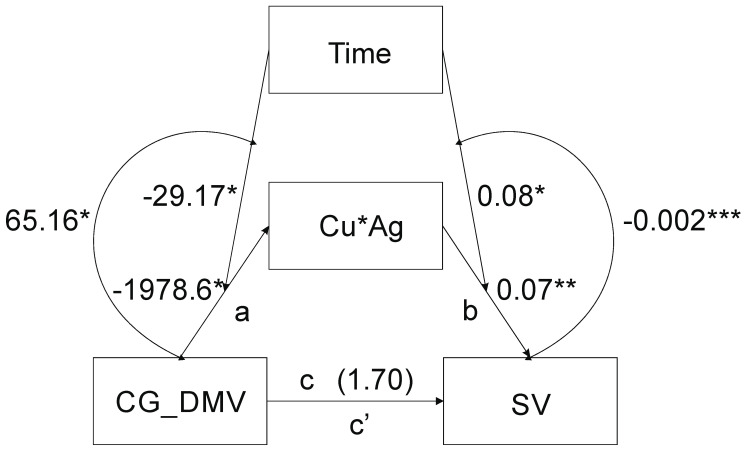
Figure 1.
The CG_DMV reflects the CG sequence contexts demethylation; SV states for sequence variation; time indicates the time of in vitro tissue cultures. Curved arrows represent interactions: left side—CG_DMV × time; right side—‘Cu*Ag’ × time. The numbers by the time arrows indicate moderation coefficients; the numbers by the arrows between CG_DMV and ‘Cu*Ag’ (path a), as well as between ‘Cu*Ag’ and SV (path b), reflect unstandardized B coefficients of mediation; the number above CG_DMV and SV arrow is the B coefficient of direct effect (DE) (path c), CG_DMV→’Cu*Ag’→SV reflects indirect effect (path c’). *—p < 0.05; ** p < 0.001.

