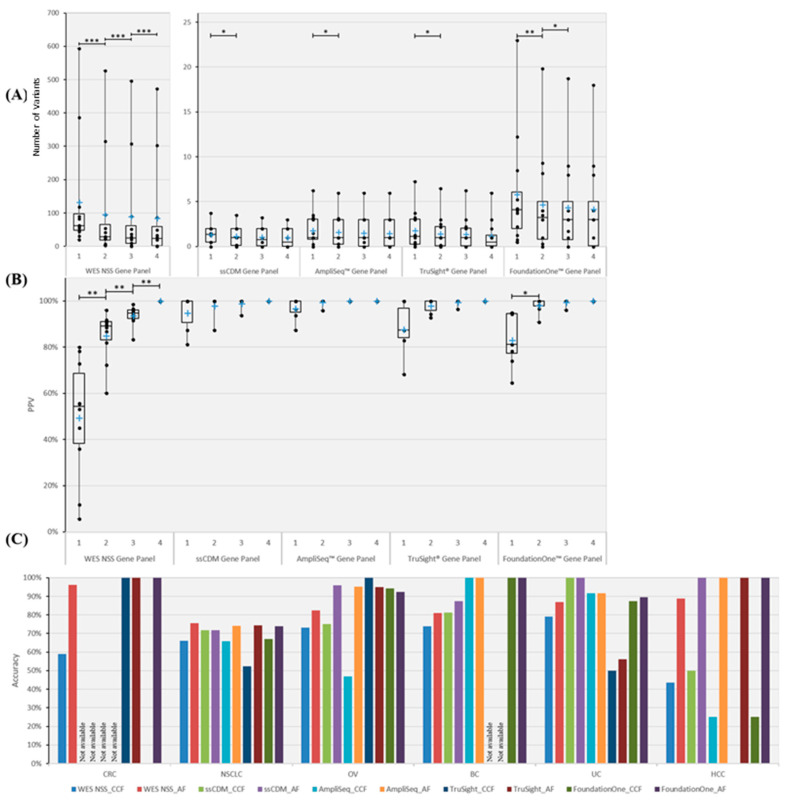
Figure 3.
Number, PPV and in silico prediction accuracy of truncal variants across different gene panels. Five gene panels were scrutinized, namely WES NSS, CGC, AmpliSeq™, TruSight® and FoundationOne™ cancer gene panels. (A) Boxplot illustrating the number of PTVs across different numbers of MRTB samples analyzed concurrently. (B) PPV of PTVs in relation to the number of MRTB samples interrogated simultaneously. (C) Best average prediction accuracy of PTVs across different cancer types. Two types of thresholds were used to classify variants into either truncal or branch, namely AF and CCF. Based on the respective threshold, the best average prediction accuracy achievable (within the defined search domain) among all patients with the same cancer type (across different gene panels) is portrayed above. A single asterisk (*) denotes p < 0.05, double asterisks (**) signify p < 0.01, while triple asterisks (***) indicate p < 0.001. A cross (+) represents the mean value of the data. ‘Not available’ signifies that no variants that are associated with the specific gene panel were found.

