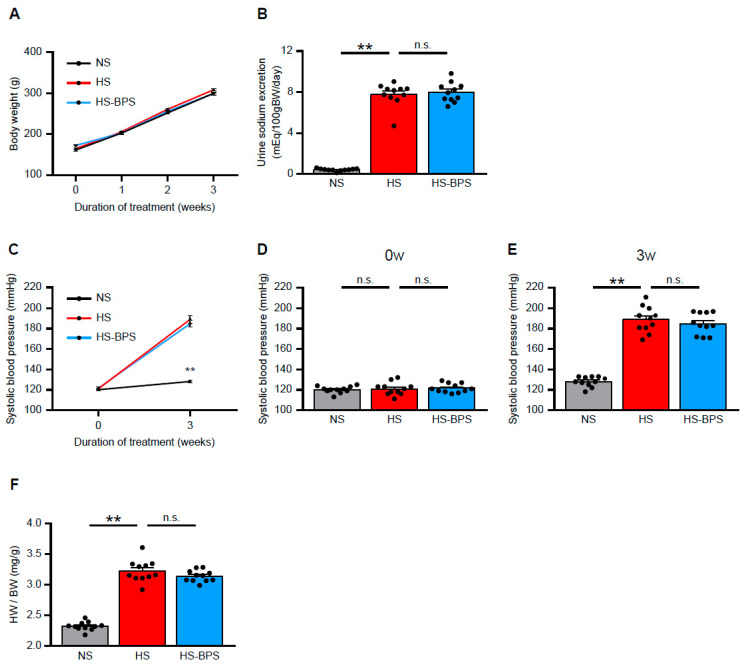
Figure 1.
Effects of BPS on blood pressure levels in high-salt-fed DS rats. (A) Change in body weight, (B) urine sodium excretion levels at 3 weeks, (C–E) systolic blood pressure levels at 0 and 3 weeks, and (F) heart weight to body weight ratio of DS rats on a normal-salt (0.5% NaCl, NS) diet, high-salt (8% NaCl, HS) diet or high-salt diet plus BPS treatment (HS-BPS) for 3 weeks (n = 11 per group). The asterisks in (C) correspond to NS vs. HS group at 3 weeks. Data are expressed as mean ± SEM. ** p < 0.01; n.s., not significant.

