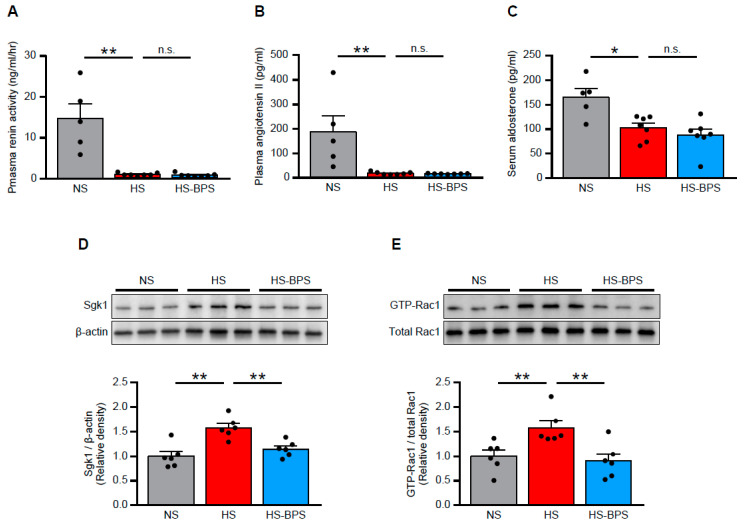
Figure 3.
BPS reduced renal MR pathway activation through Rac1 activity suppression in high-salt-fed DS rats. (A) Plasma renin activity, (B) plasma angiotensin II concentration, and (C) serum aldosterone concentration in NS, HS, and HS-BPS rats (n = 5 for NS, n = 7 for HS, n = 7 for HS-BPS rats). (D) Western blot analysis of MR downstream effector Sgk1 in the renal cortex. Blots show biological replicates, and bar graphs show the results of quantitation (n = 6 per group). (E) Western blot analysis of GTP-bound Rac1 in the renal cortex. Blots show biological replicates, and bar graphs show quantitation results (n = 6 per group). Data are expressed as mean ± SEM. * p < 0.05; ** p < 0.01; n.s., not significant.

