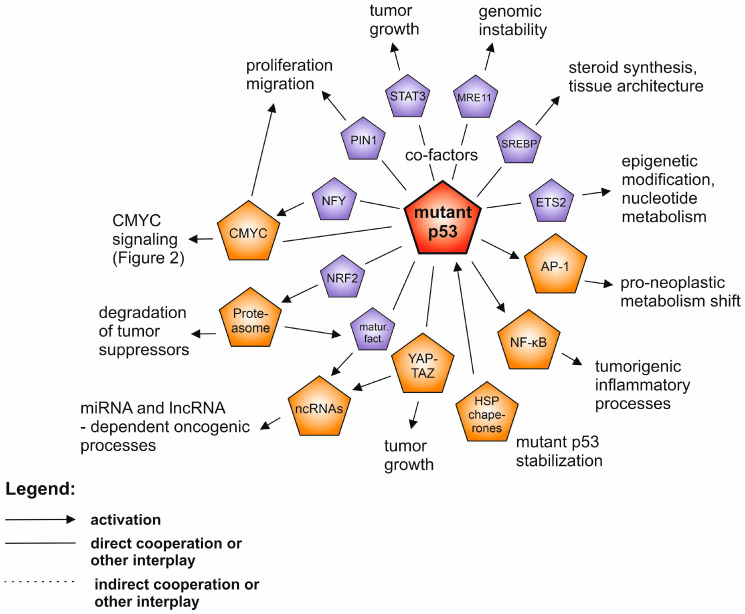
Figure 1.
The network of the interplay between mutant p53 (highlighted in red) and other oncogenic drivers in human neoplasia. The drivers described in separate paragraphs are shown in orange, while additional oncoproteins are shown in purple. Only the selected and well supported connections are shown, as described in the text.

