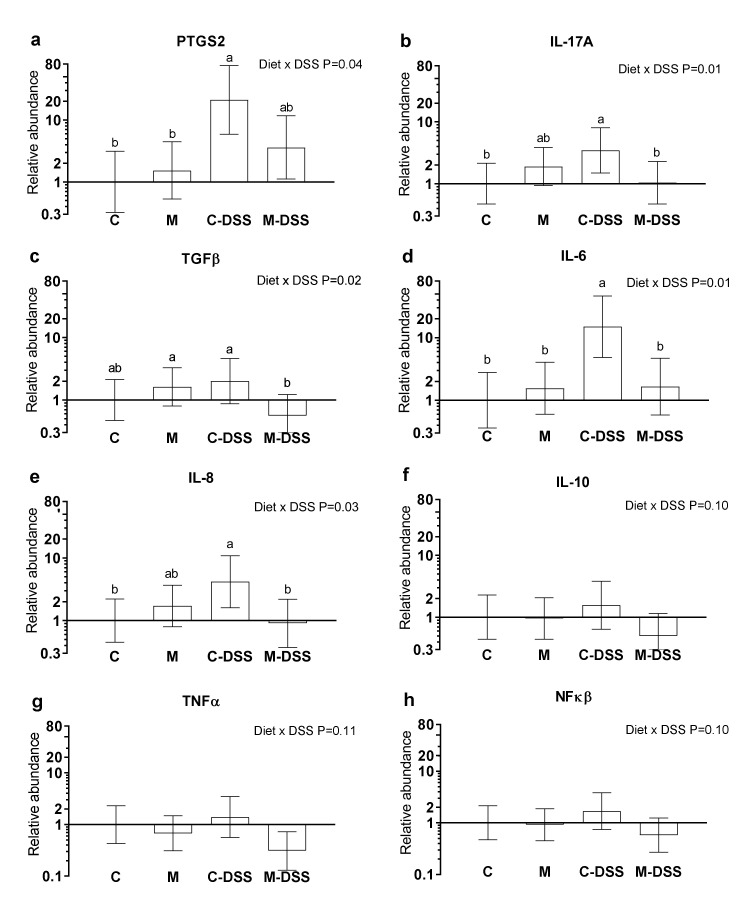
Figure 4.
Relative mRNA abundance in the colon of pigs fed the control diet (C), the meat diet (M), the control diet + DSS (C-DSS) or the meat diet + DSS (M-DSS) (n = 6/group except C-DSS n = 5). (a) PTGS-2; (b) IL-17A; (c) TGFβ; (d) IL-6; (e) IL-8; (f) IL-10; (g) TNFα; (h) NFκβ. Data are presented as the means ± 95% confidence intervals relative to the abundance in the control-treated pigs (relative expression = 1.00). Note that the scale on the Y-axis is logarithmic and that the units are arbitrary. Statistically significant (p ≤ 0.05) effect of treatment is indicated with different letters (a,b).

