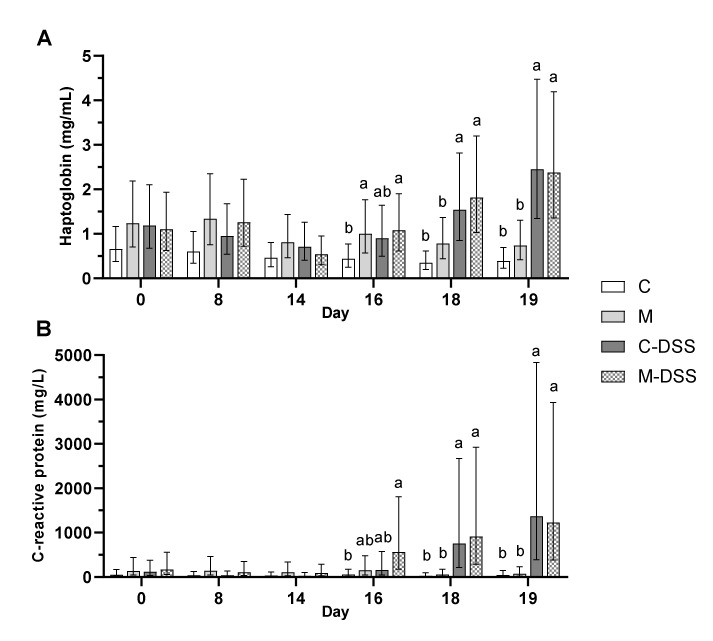
Figure 5.
Haptoglobin (A) and C-reactive protein (CRP; B) in plasma of pigs receiving the four different treatments from day 14 to 18 (n = 6/group, except C-DSS n = 5). Data are presented as LS means ± 95% confidence intervals due to logarithmic transformation of data. Different letters indicate a significant effect of treatment within day (p ≤ 0.05).

