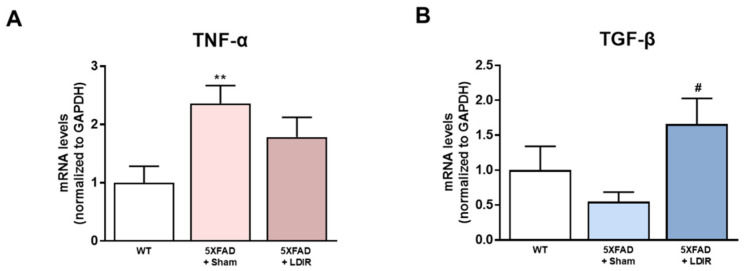
Figure 2.
The modulatory effects of LDIR on production of M1/M2 cytokines in the brain of 5XFAD mice. (A) Level of TNF-α mRNA was checked by qRT-PCR. (B) Level of TGF-β mRNA was measured by qRT-PCR. ** p < 0.01 indicate significant differences between the wild-type (WT) and sham-treated 5XFAD mice. # p < 0.05 indicate significant differences between the sham- and LDIR-treated 5XFAD mice. Data are presented as mean ± SD (n = 3 mice each group).

