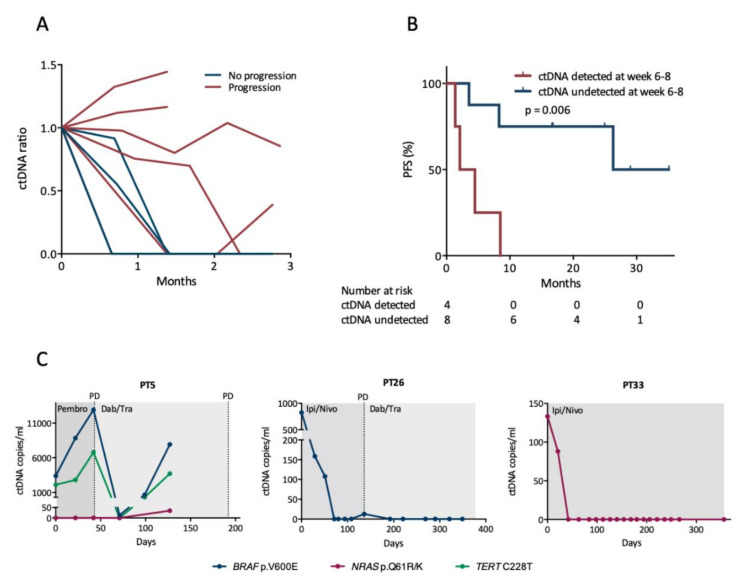
Figure 2.
Early changes in circulating tumor DNA (ctDNA) levels. (A) Changes in ctDNA levels during the initial three months of first-line therapy. Lines discontinued before three months represent the last sample prior to or at disease progression. The ctDNA ratio reflects changes from the baseline sample. Only patients with ctDNA detected at baseline are represented (n = 6 with progression, n = 3 without progression). (B) Survival analysis for PFS according to whether ctDNA was detected at week 6–8 after therapy initiation. The difference between the groups was calculated using the log-rank test. (C) Examples of longitudinal monitoring of ctDNA levels during therapy. Time is depicted on the x-axis as days since treatment start. Abbreviations: Ipi/Nivo, ipilimumab/nivolumab; Dab/Tram, dabrafenib/trametinib; Pembro, pembrolizumab; PD, progressive disease.

