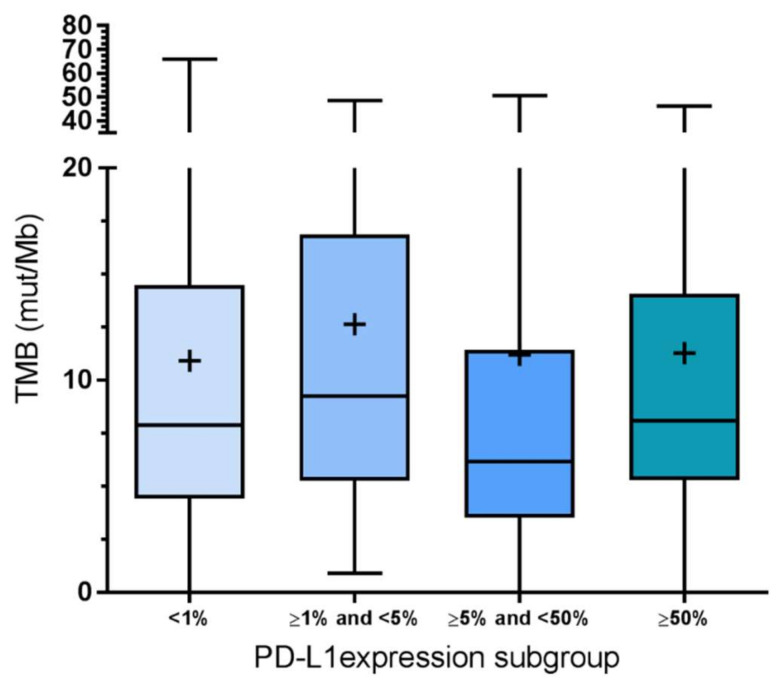
Figure 5.
TMB is not different in the four groups of the PD-L1 tumor proportion score. Data are presented as box plots with a 95% confident interval. The line indicates the mean, the + indicates the median. Statistical analysis by ANOVA did not reveal significant (p < 0.05) differences in TMB between TPS groups.

