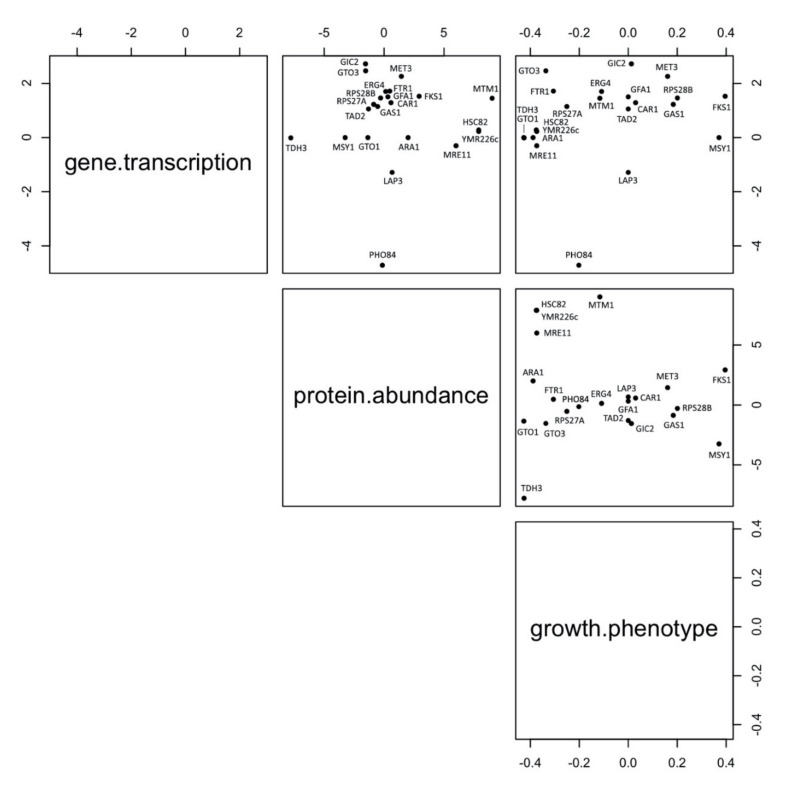
Figure 10.
Scatterplot matrix of the independent variables: transcriptome, proteome, and phenome. Three-dimensional scatterplot representing the correlation among gene expression, protein abundance and growth phenotype. Phenomics data are taken from Marmiroli et al., 2016, transcriptomics data from Pagano et al., 2019.

