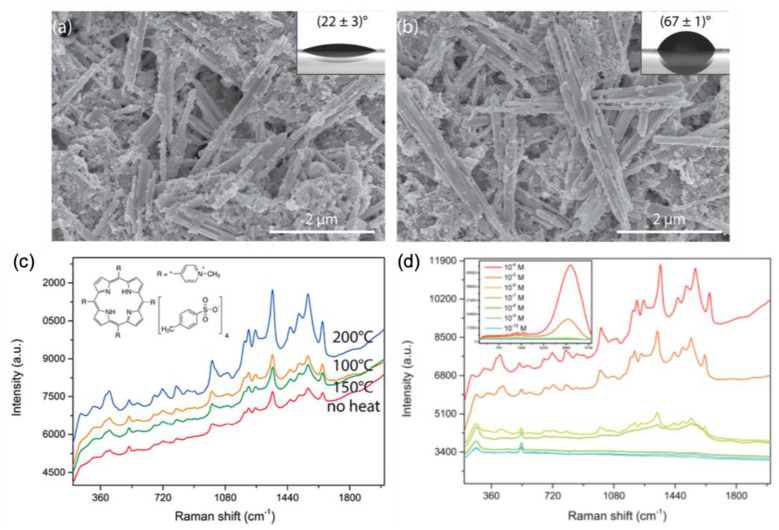
Figure 5.
SEM pictures of (a) ZnO nanowires not annealed, and (b) annealed at 200 °C. Insets display contact angles for each surface. (c) SERS spectra of TMPyP recorded on Ag/ZnO nanowires for several temperatures. (d) SERS spectra of TMPyP recorded on Ag/ZnO nanowires annealed at 200 °C for various concentrations of TMPyP. Inset in (d) displays the whole spectrum with fluorescence signal that appears when the concentration is superior or equal to 10−5 M. All the figures are reprinted (adapted) with permission from [86], Copyright 2020 American Chemical Society.

