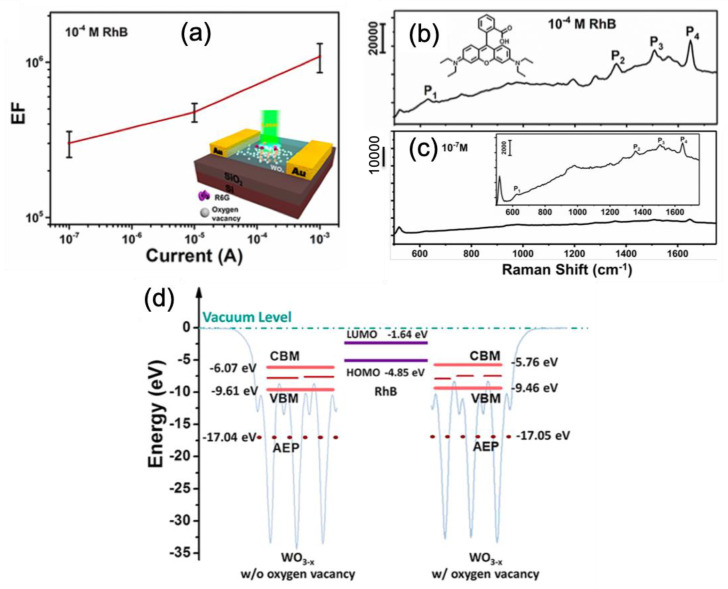
Figure 7.
(a) Enhancement factor for SERS signal versus leakage current for a rhodamine B (RhB) concentration of 0.1 mM, and the inset represents the structure scheme. SERS spectra of RhB recorded for a leakage current of 1 mA with an RhB concentration of (b) 0.1 mM and (c) 0.1 M (at detection limit (LOD)), and the insets of the figures (b) and (c) represent a molecular scheme of RhB and a zoom on the SERS spectrum, respectively. (d) Illustration and alignment of energy levels of WO3−x film without oxygen vacancies (at left), RhB molecule (at center), and WO3−x film with oxygen vacancies (at right). All the figures are reprinted (adapted) with permission from [99], Copyright 2019 American Chemical Society.

